Bullish View
Set a buy-stop at 50,000.
Add a take-profit at 52,000 and a stop-loss at 49,000.
Timeline: 2 days.
Bearish View
Set a sell-stop at 48,000 and a take-profit at 46,000.
Add a stop-loss at 49,000.
The BTC/USD price has gone nowhere this week as investors assess its recent strong rally. Bitcoin is trading at $48,367, which is slightly below this week’s high of more than $50,542. The coin has a market capitalization of more than $913 billion.
Bitcoin Price Rally Fades
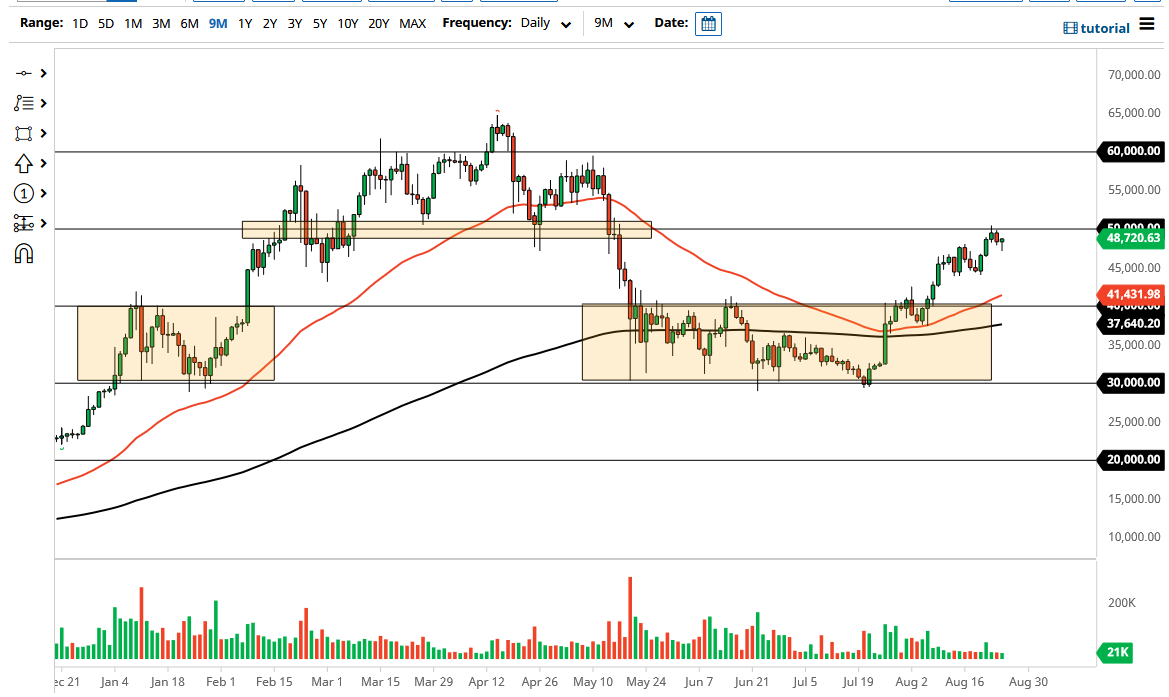
The BTC/USD has been in a spectacular rally in the past few weeks. The pair has managed to rally from slightly below $30,000 in July to more than $50,000 this week. The rally was mostly because of technical reasons as investors believed that it had found a strong bottom.
Another reason for the rally is that the Securities and Exchange Commission (SEC) has hinted that it will allow Bitcoin Exchange Traded Funds (ETFs). These ETFs will create a cheaper and safer option for institutional investors to buy and hold Bitcoin. The current main option for them is to use the expensive Grayscale Bitcoin Trust.
Further, more companies have started to adapt and offer cryptocurrency services. Earlier this week, PayPal announced that it would expand its crypto offerings to the UK. The company’s customers in the country will be able to buy, sell, and hold Bitcoin using PayPal. This is notable since PayPal is one of the biggest FinTech firms in the world.
At the same time, Visa announced that it had acquired a non-fungible token (NFT) for $150,000. While this NFT did not involve Bitcoin, the acquisition meant that the company was a believer of the blockchain technology.
Looking ahead, like all other assets, the BTC/USD pair will today react to the speeches at the Jackson Hole summit. Still, with the summit taking place virtually, the impact will be relatively muted. Historically, the main movers at the summit are usually the interviews carried out by media entities like Bloomberg and CNBC.
BTC/USD Analysis
The BTC/USD pair found a strong resistance when it rose to 50,000. This resistance was expected because of the psychological nature of 50,000. On the four-hour chart, the pair has found the resistance at the 50-day and 25-day exponential moving averages (EMA). It has also formed a rising wedge pattern that is shown in red. In price action, a wedge pattern is usually a bearish sign. Now, with the wedge nearing the confluence zone, there is a possibility that it will have a pullback in the coming days.

