The difference between success and failure in Forex trading is likely to depend mainly on which currency pairs you choose to trade each week and in which direction, and not on the exact trading methods you might use to determine trade entries and exits.
When starting the trading week, it is a good idea to look at the big picture of what is developing in the market as a whole and how such developments are affected by macro fundamentals and market sentiment.
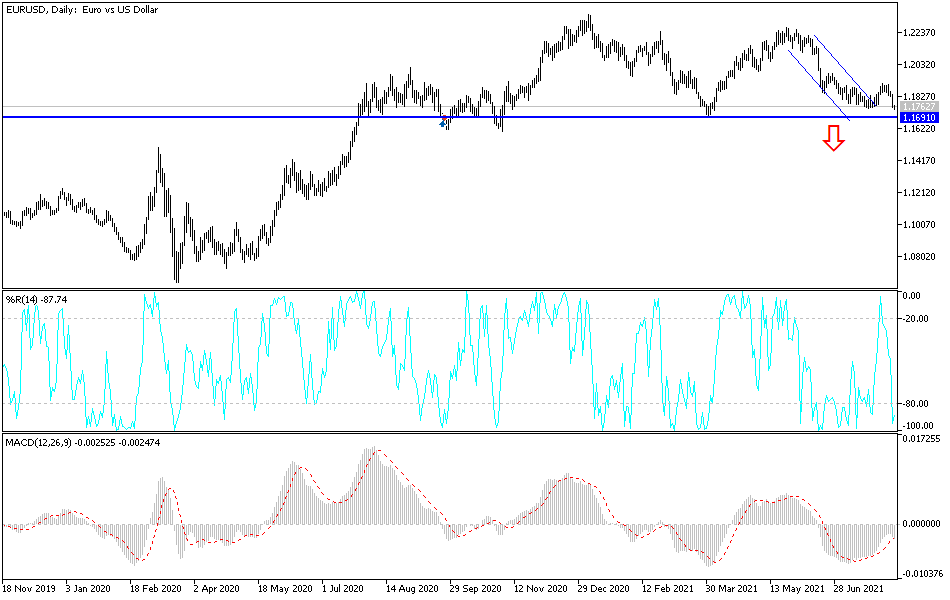
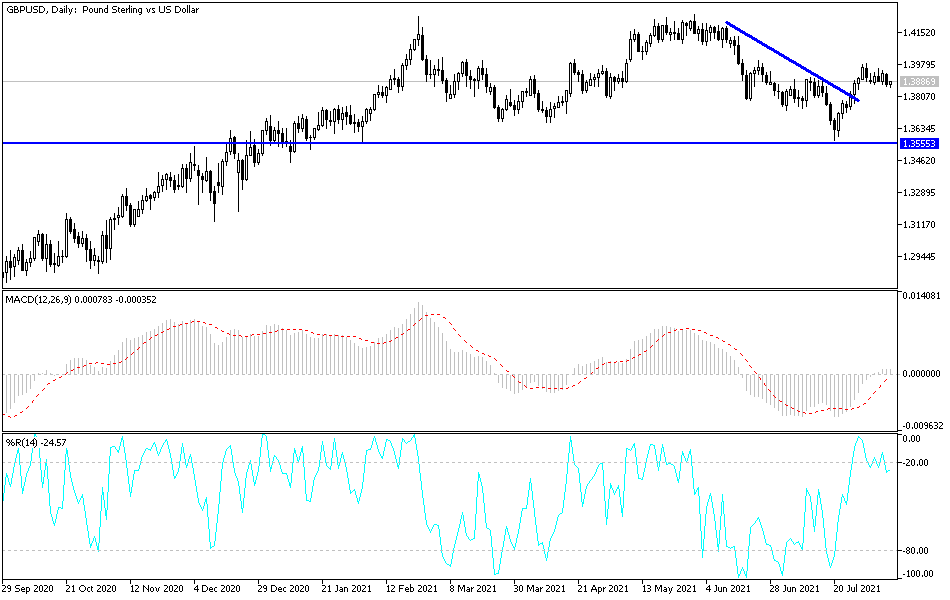
The S&P 500 is maintaining its uptrend with an unnerving sense of purpose. EUR/USD has been in a sideways channel for about a year, but the bigger picture looks bearish. The GBP/USD has been in a sideways channel for about six months, and, similar to EUR/USD, its bigger picture also looks bearish. As with any major reversal in trend, it will take the price some time to turn over into a new direction. The USD/CAD could be starting a new uptrend based on a long-term support level from 2017. Bitcoin has begun a new uptrend in recent weeks after losing more than half its value from its peak.
Big Picture, 9th August, 2021
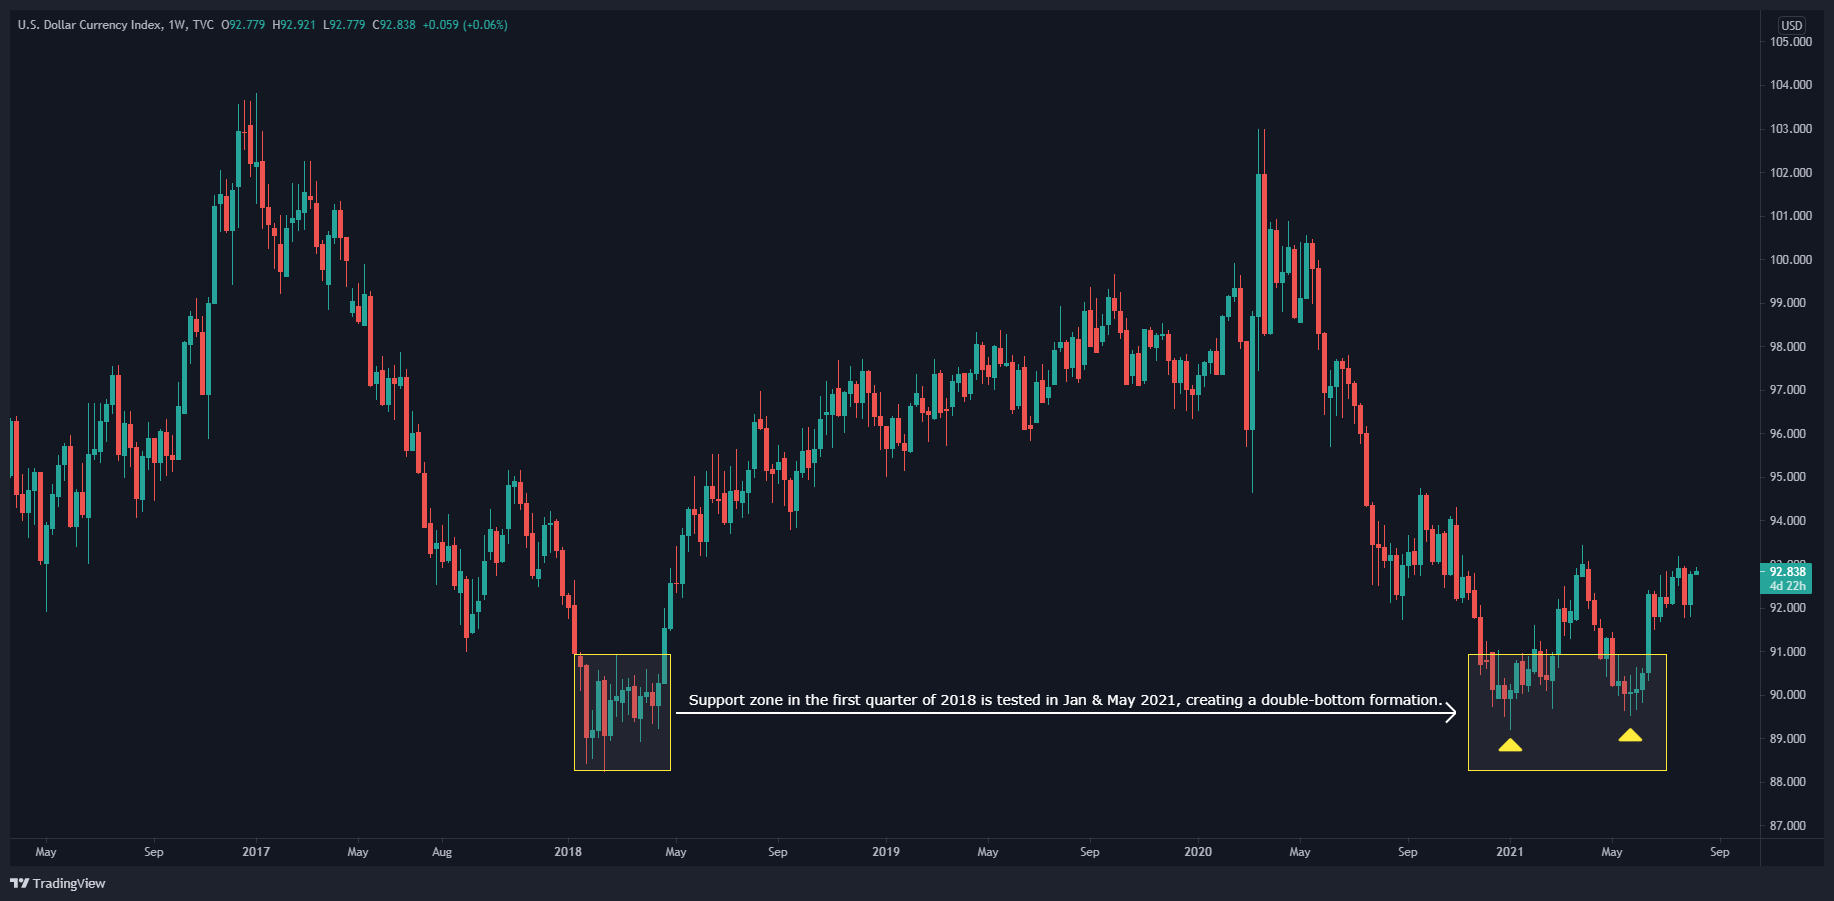
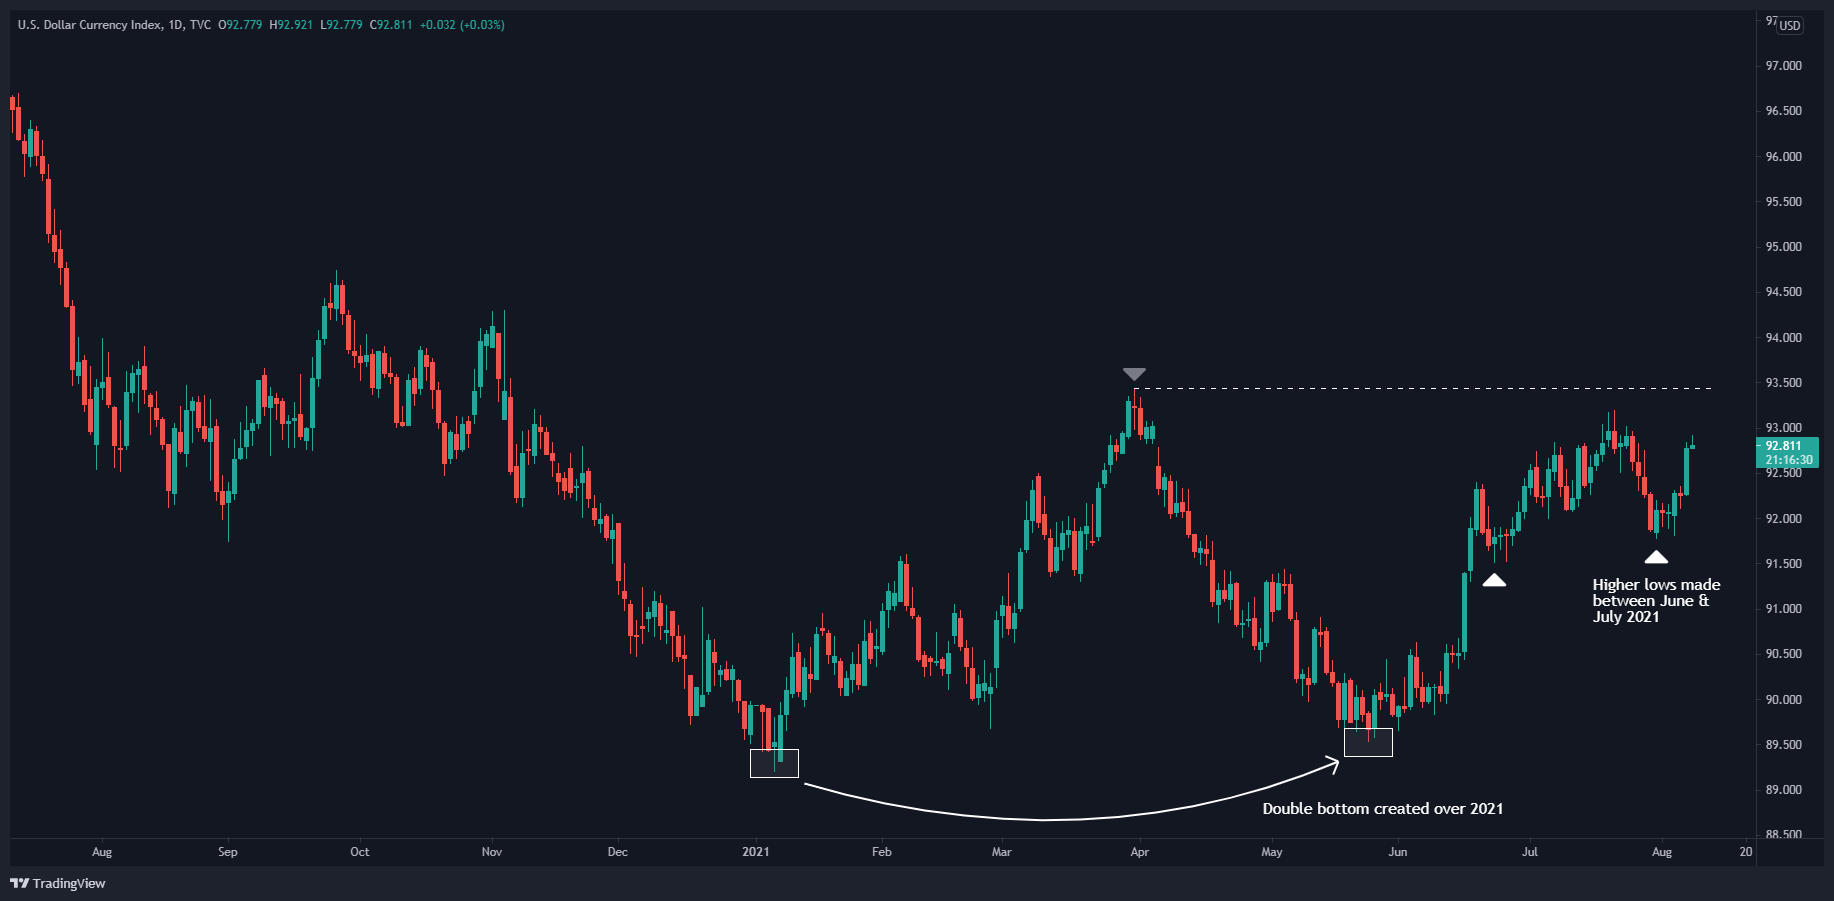
The US Dollar Index created a double-bottom formation on the chart in January and May 2021, which lined up with a support area made in early 2018.
Since then, the US Dollar Index has made a sequence of higher lows, a defining feature of an uptrend. The index is approaching resistance, made in 31st May, 2021, that it will have to overcome to maintain its upward trajectory.
Last week, the biggest day for all the Forex major pairs, and, consequently, the US Dollar Index, was Friday, 6th August, when the U.S. Labor Department’s closely watched monthly payrolls report posted stronger-than-expected employment numbers. This led to a bullish move for the USD against all the larger currencies. The employment data also helped push the S&P 500 to another record-high close.
The positive job data were against a backdrop of concerns on many fronts. Worries about “peaking” economic growth saw the S&P 500 fall at the beginning of the week, and the US Dollar Index also declined, but only slightly. The Delta variant of the coronavirus, pushing many hospitals to near capacity, is upending previously laid plans of how to open parts of the economy and allow travel between nations. It seems, barring newer variants, that vaccination rates will hold the key to moving past coronavirus. Extreme weather events – floods, record temperatures, and wildfires that have wiped out entire towns – almost certainly due to climate change, are not going away.
S&P 500
To repeat the words in my last analysis of the most important equity index in the world, “Buy the stock market, and just hold it” was the first piece of advice I was given about investing. When I look at the recent actions of the S&P 500, nothing feels truer. The S&P 500 is maintaining its uptrend with an unnerving sense of purpose as the index has shaken off any concern you could throw at it, from peaking economic growth, historically high valuations, coronavirus variants, and extreme weather events, to name a few.
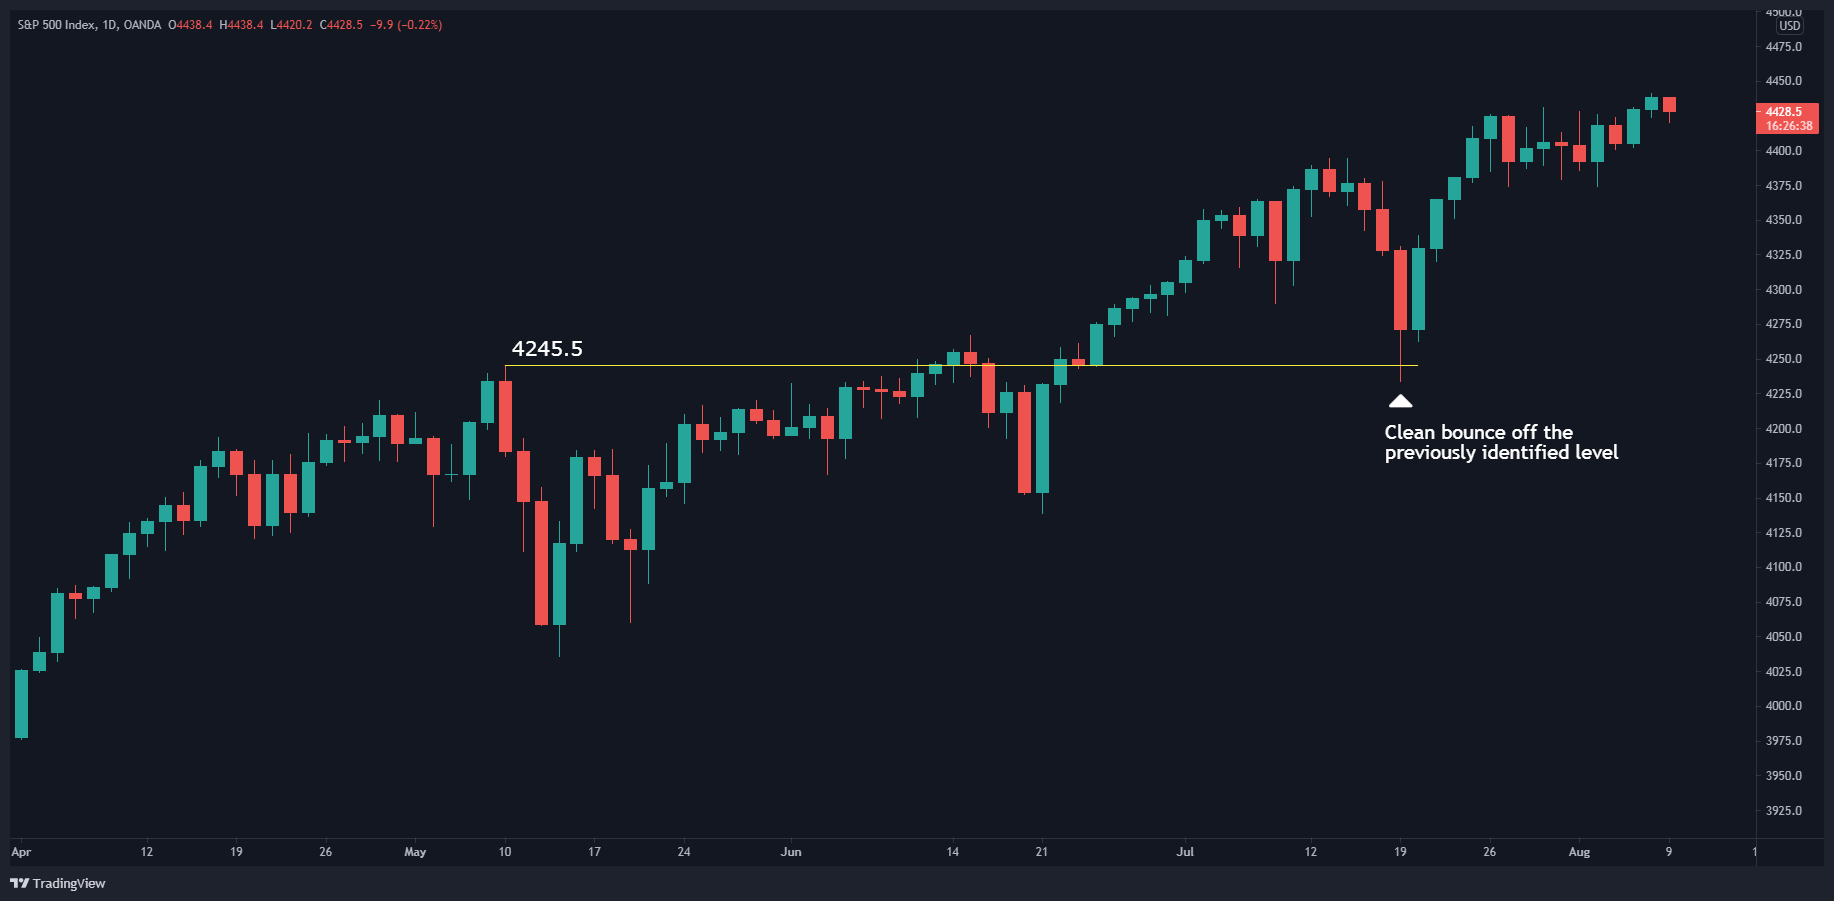
Our S&P 500 strategy is to buy on dips, preferably when it retests a previous resistance level. When I last analyzed the S&P 500 on 18th July, I highlighted the 4245.5 level as a point to enter the market if it came down to the price. In the spirit of full disclosure, I wasn’t confident the market would come down to that price to give us the trade. But the very next trading day, the price came down intraday, bounced off that level and never looked back.
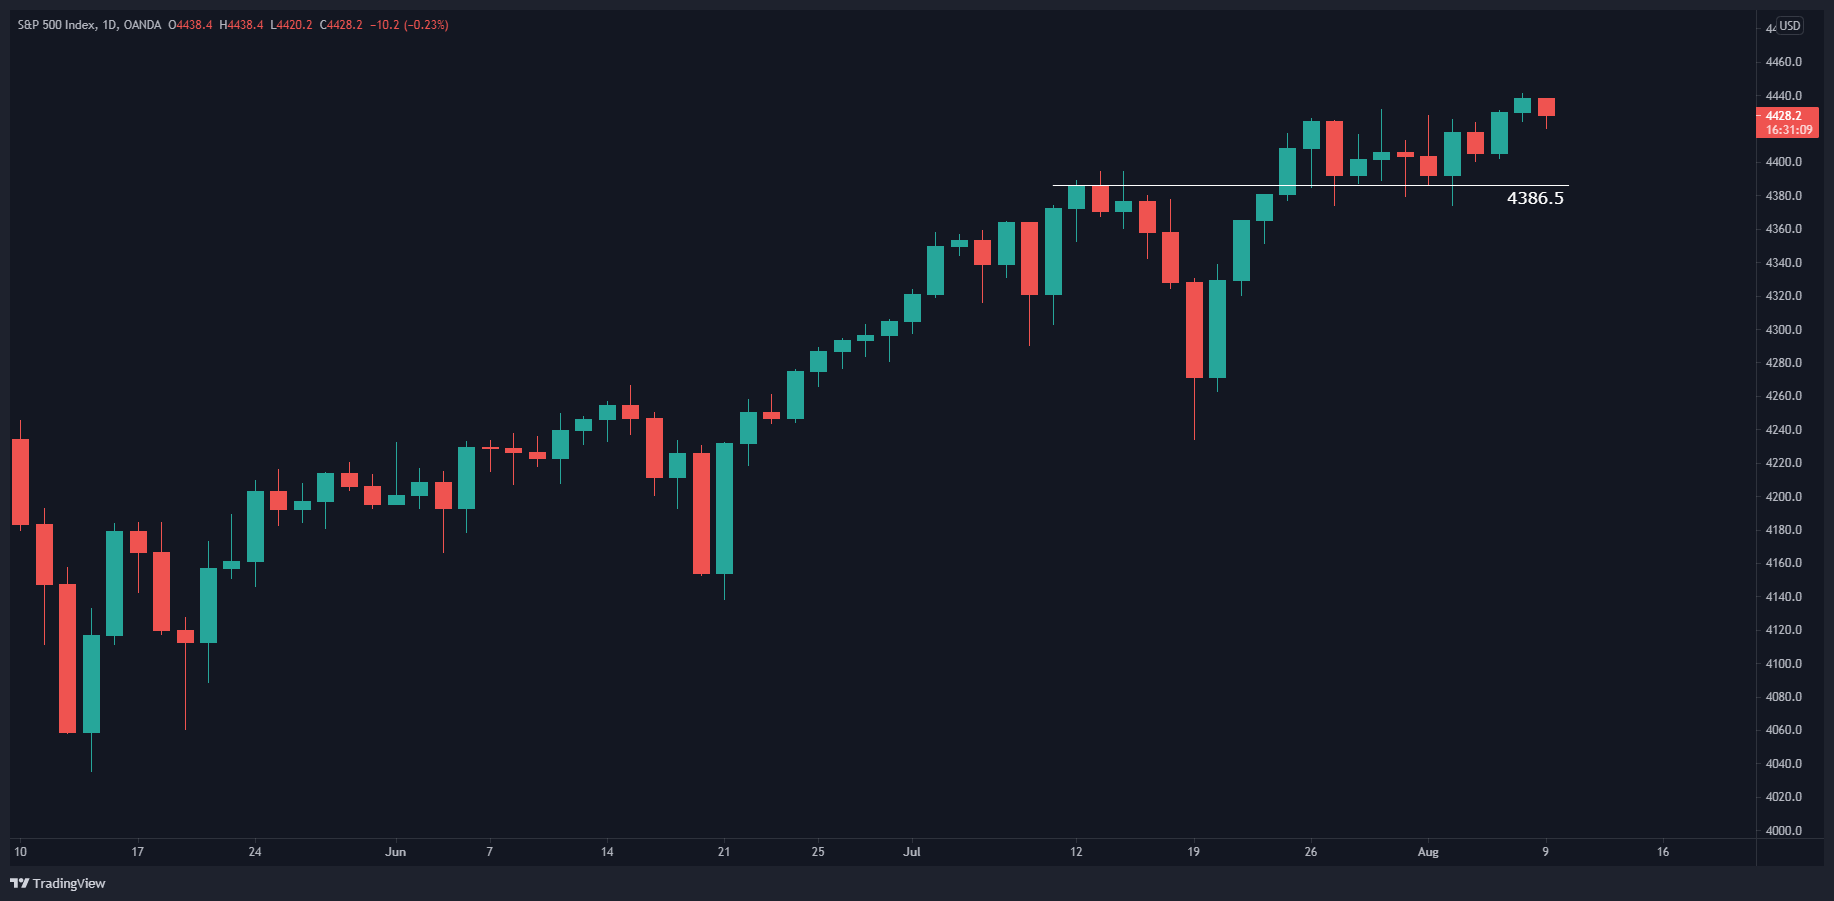
Looking forward, what’s the next key level? On 12th/13th July, the price stalled at around the 4386.5 level, with the daily candles unable to close above it. When price eventually broke through, after making a dip, it’s testing the level as a support.
This is clearer on the 4-hour chart.
What would make me reconsider the uptrend and look for a potential market top? If the market broke support levels at 4138, made on 21st June, and 4035, made on 13th May. The last significant support was made way back in September 2020 at 3210.
EUR/USD
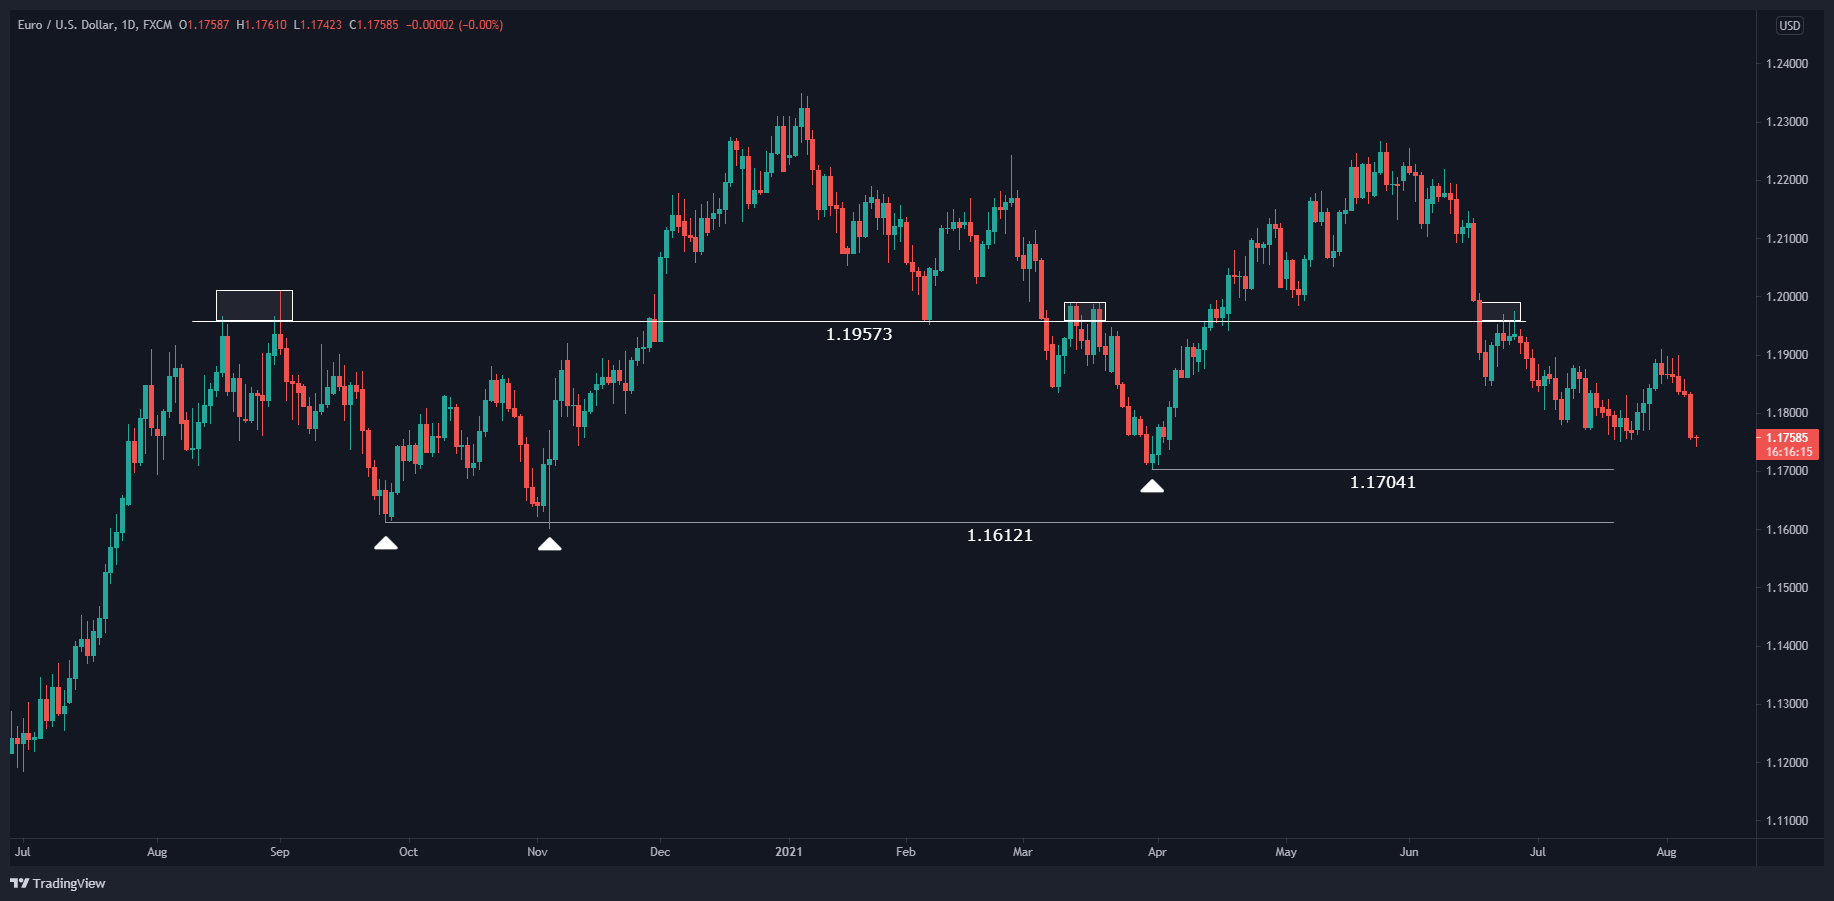
The EURUSD is potentially starting a new downtrend. A reversal zone made in the first quarter of 2018 was tested in January 2021 and May 2021, creating a double-top formation on the chart.
On the daily chart, the market is below 1.19573, a key interchangeable support/resistance level. The next support levels price must break to continue trending down are 1.17041 and 1.16121.
GBP/USD
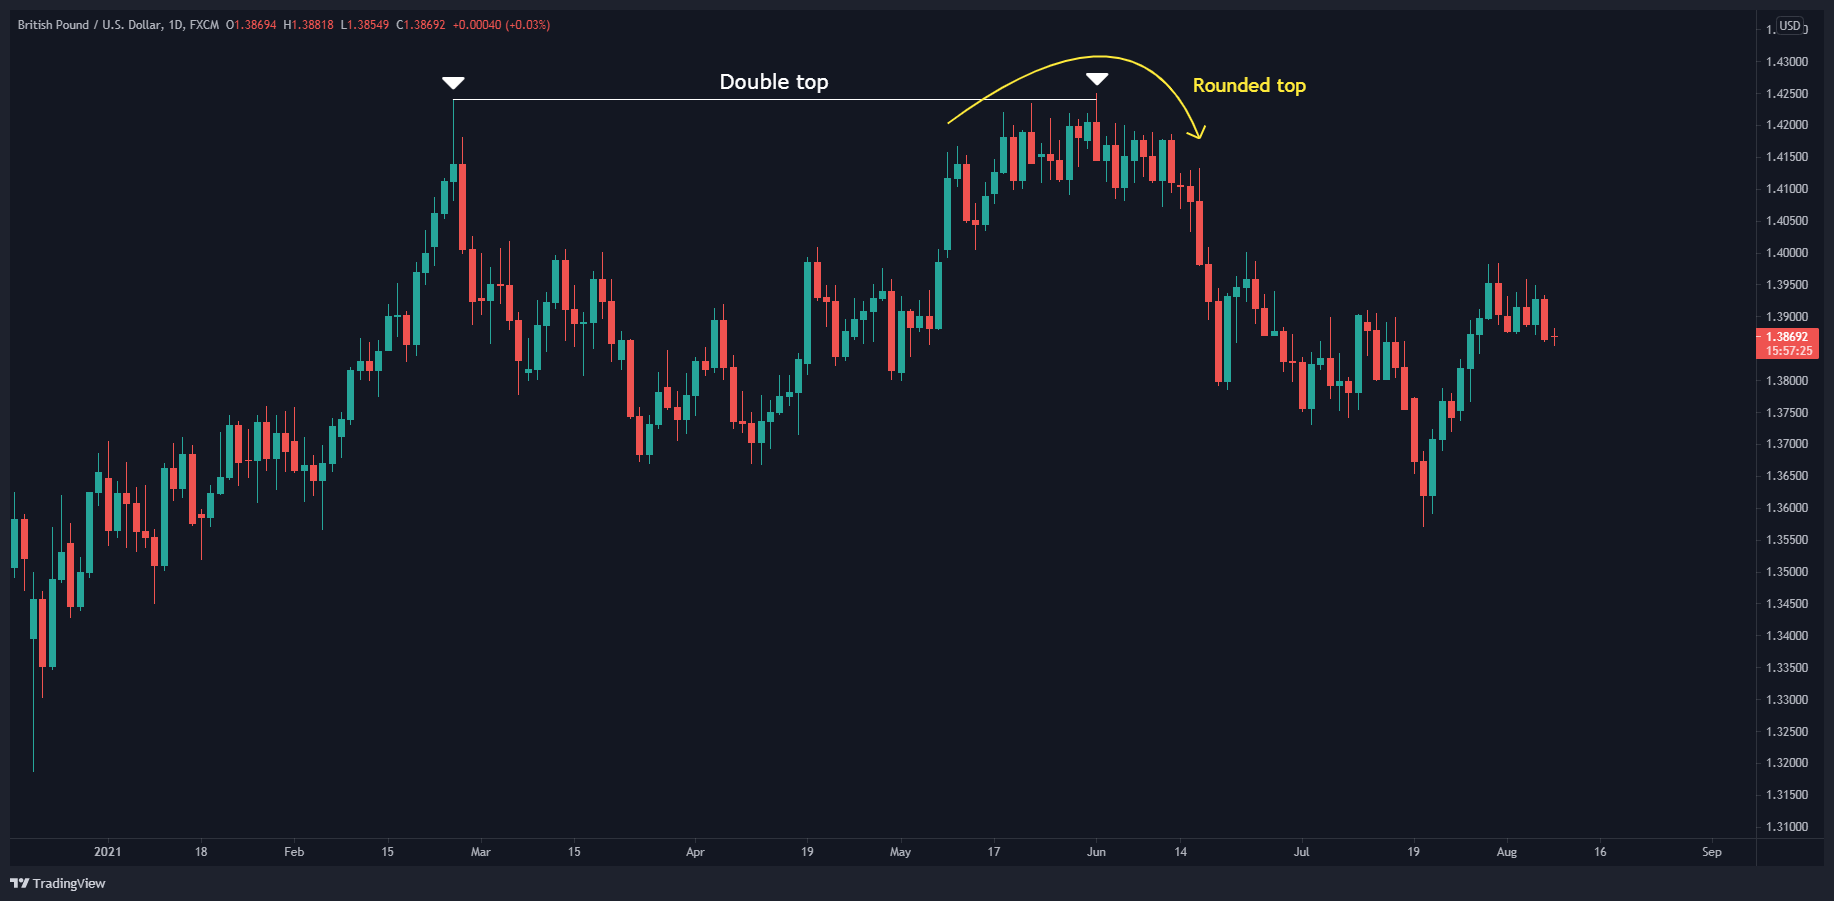
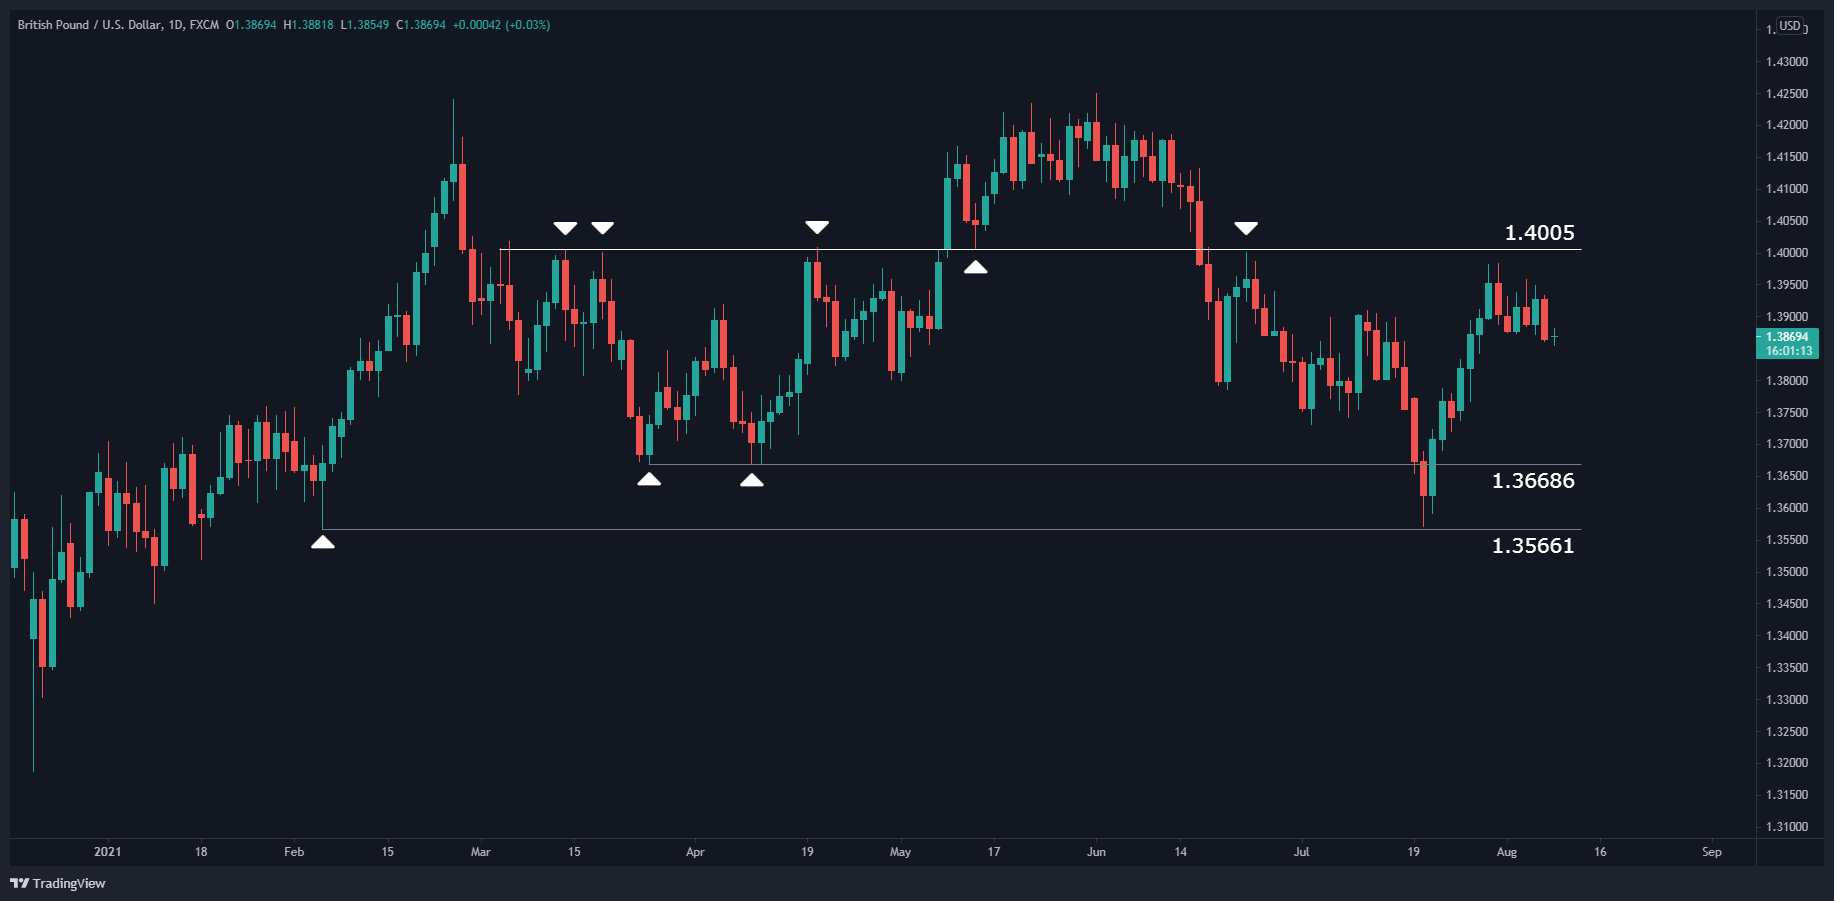
A reversal zone made in the first quarter of 2018 was tested in February 2021 and June 2021, creating a double-top formation on the chart. But the price is still firmly in the reversal area.
On the daily chart, it’s clear the price is stuck in a sideways pattern. That said, there are several clues to a potential bearish move. The price made a double-top, and the second peak was a “rounded top” formation that can act as a strong resistance.
Looking at where the price is sitting right now, it is below 1.4005, a key interchangeable support/resistance level. The next support levels the price is capable of reaching are 1.36686 and 1.35661.
USD/CAD
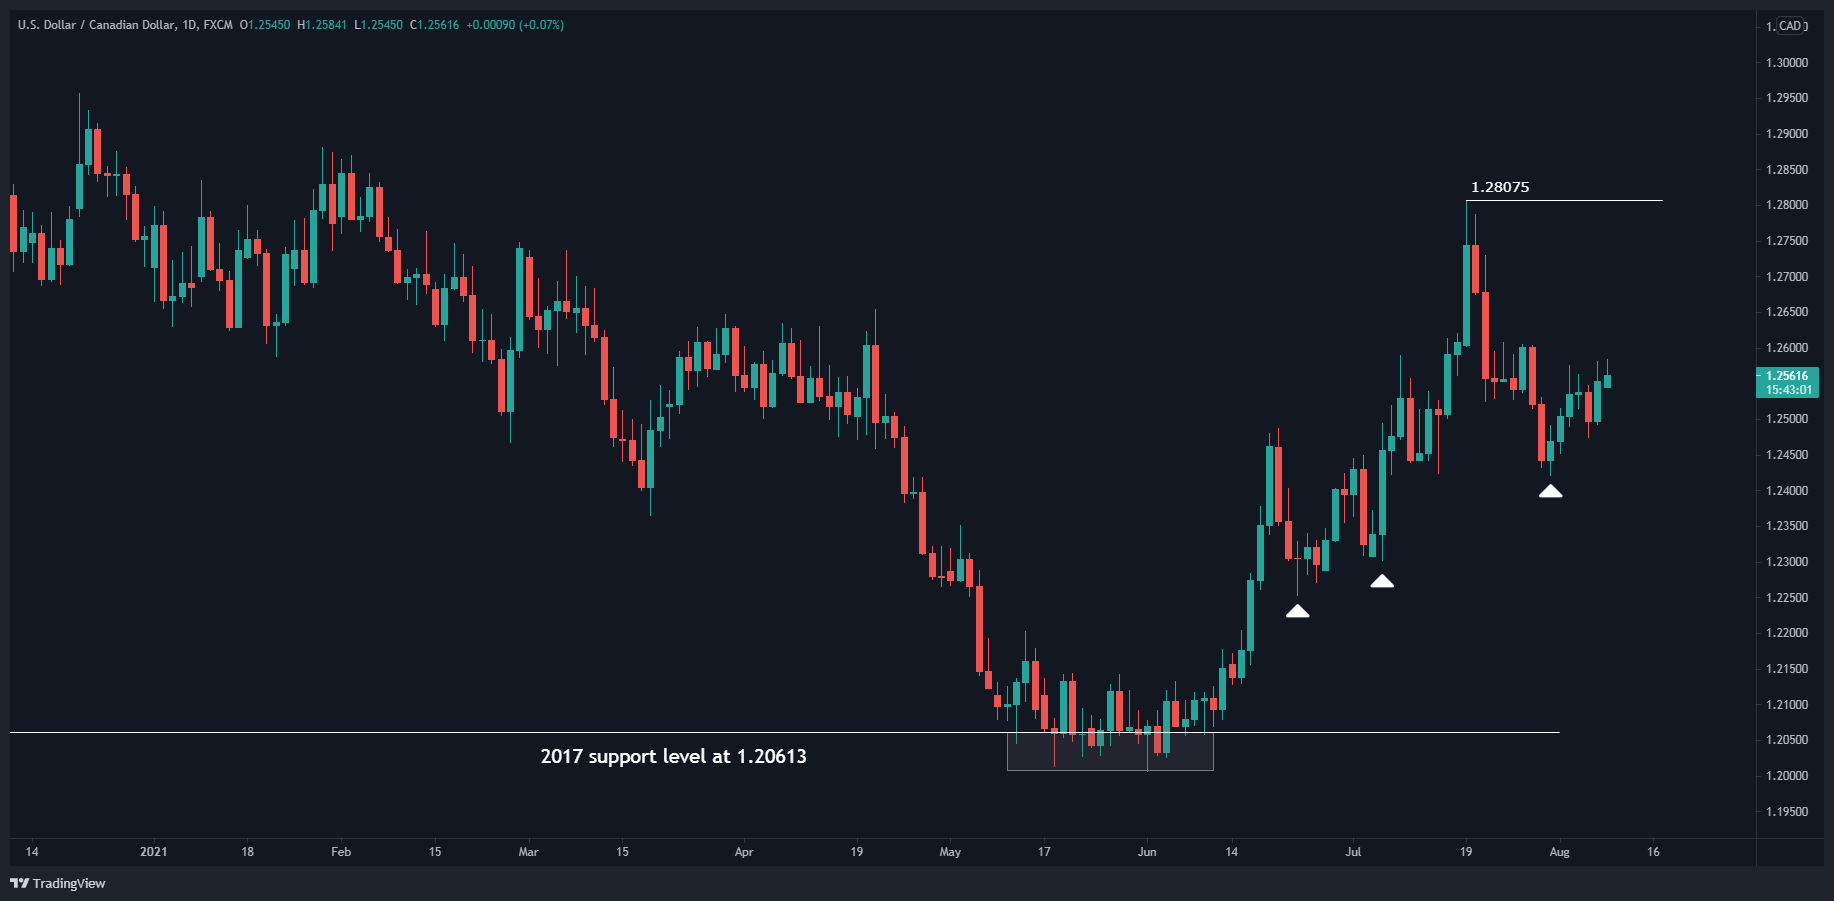
In May/June 2021, the USD/CAD bounced off a long-term support level made in September 2017 at 1.20613.
On the daily chart, the price has made a series of higher lows since bouncing off the long-term support at 1.20613. However, it has made a minor resistance at 1.28075 that it must break.
BTC/USD – Bitcoin
Bitcoin peaked at nearly $65,000 in mid-April but then went on to lose more than half its value in a little over a month. It finally found stopped dropping in value at around $30,000 and made strong support over two months. Since 21st July, it has begun an uptrend and broken the last minor resistance at $41,340, which is a bullish sign for its current uptrend.
Bottom Line
The best opportunity I see in the markets is to go long S&P 500 – I would look at the 4-hour chart to buy off support levels. I see short opportunities in EUR/USD and GBP/USD – similarly, I would look at the 4-hour chart to enter off resistances. I see a potentially long-term bullish trend unfolding in USD/CAD, and a new bullish trend in Bitcoin.


