Bullish View
- Set a buy-stop at 1.3800 and a take-profit at 1.3900.
- Add a stop-loss at 1.3700.
- Timeline: 1-2 days.
Bearish View
- Set a sell-stop at 1.3725 (this week’s low).
- Add a take-profit at 1.3650 and a stop-loss at 1.3800.
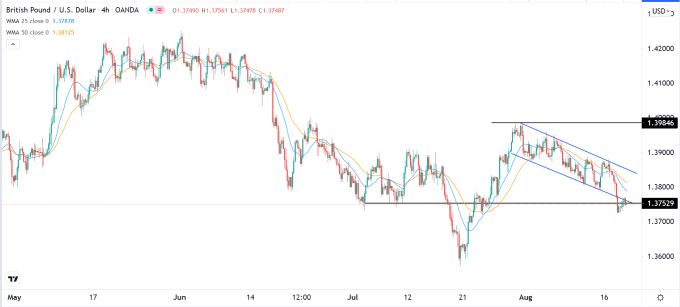
The GBP/USD pair retreated during the American and Asian sessions after the latest UK inflation data and FOMC minutes. The pair fell to 1.3720, which was the lowest level since July 26.
FOMC Minutes
The Federal Reserve published the minutes of the last meeting on Wednesday evening. In this meeting, the bank left interest rates unchanged between 0% and 0.25%. The members also hinted that they will start deliberating on the quantitative easing (QE) tapering in the coming meetings.
The minutes showed that more members were open to the idea of tapering if the economy maintains its momentum.
They echoed the recent statements by Fed officials. In an interview with the FT, Fed’s Eric Rosengreen said that he will support tapering. He argued that the key solution to the American economy was for the government to end some of its fiscal stimulus that were encouraging people not to work.
In a similar interview with the FT, Fed’s Mary Daly said that the Fed could start winding down the asset purchases as soon as this year. Still, this will depend on the impacts of the Delta variant on the American economy.
The GBP/USD declined as data showed that consumer prices were starting to ease in July. The headline consumer price index declined from 2.5% in June to 2.0% in July. This was in line with the Bank of England’s target. On a month-on-month basis, the headline CPI declined from 0.5% to 0.0%.
In the same period, core CPI declined from 2.3% to 1.9%. Therefore, there is a possibility that the Bank of England (BOE) will maintain interest rates at the present levels in its September meeting.
The GBP/USD price will next react to the latest US initial jobless claims numbers. The data is expected to show that the number of people filing for jobless claims declined last week.
GBP/USD Technical Analysis
The four-hour chart shows that the GBP/USD pair has been in a downward trend after it rose to 1.3985 last week. It dropped to 1.3750, which is slightly below the 25-day and 50-day moving averages. The pair is at the right shoulder of the inverse head and shoulders pattern. In price action, this is is usually a bullish sign.
Therefore, the contrarian case is that the pair will likely rebound in the next few days. This view will be invalidated if it drops below the right shoulder of the pattern.

