Bullish view
- Set a buy-stop at 1.3800 and a take-profit at 1.3900.
- Add a stop-loss at 1.3700.
- Timeline: 2 days.
Bearish view
- Set a sell-stop at 1.3700 and a take-profit at 1.3600.
- Add a stop-loss at 1.3800.
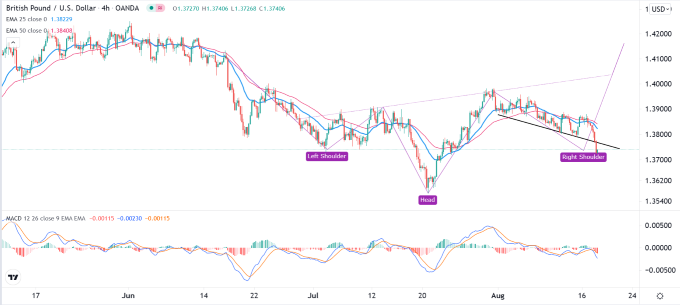
The GBP/USD price declined below a key support level ahead of the July UK consumer price index (CPI) data. The pair fell to 1.3730, which was the lowest level since July 23rd.
UK Inflation Data
The GBP/USD declined substantially even after the UK published strong employment numbers and the US released weak retail sales data. On Tuesday, data by the Office of National Statistics (ONS) showed that the UK unemployment rate declined to a post-pandemic low of 4.7% in June as the country reopened. This was better than the median estimate of 4.8%.
The UK added 95k jobs in the three months to June, higher than the previous 25k. The number was better than what analysts were expecting. Further, wages continued rising in June as employers struggled to find workers. With bonuses, wages rose by 8.8% while without bonuses, they rose by 7.4%.
Meanwhile, in the United States, data showed that retail sales dropped substantially in July. Retail sales declined by 1.1%, which was lower than the expected drop of 0.3%. Core retail sales, on the other hand, declined by 0.4% in July. Other numbers showed that the country’s manufacturing and industrial production bounced back in June.
Today, the GBP/USD will react to consumer and producer inflation numbers from the UK. The numbers are expected to show that inflation remained above the Bank of England’s target of 2.0%. The headline CPI is expected to rise by 2.3% on a year-on-year basis, lower than the previous 2.3%. At the same time, core CPI is expected to have declined from 2.3% to 2.2%.
The producer price index input is expected to rise by 9.1% while output rose by 4.4%. Stronger UK inflation numbers will be relatively bullish for the British pound.
GBP/USD Forecast
The GBP/USD pair declined below the important support shown in black after the US retail sales numbers. By so doing, the pair managed to invalidate the bullish flag pattern that has been forming recently, the 4H chart, the pair has formed an inverted head and shoulders pattern, which is usually a bullish sign.
It also managed to move below the 25-day and 50-day moving averages while the two lines of the MACD moved below the neutral line. Therefore, the pair will likely bounce back because of the inverted H&S pattern.

