Bullish View
Set a buy-stop at 1.3900 and a take-profit at 1.3982 (July high).
Add a stop-loss at 1.3840.
Timeline: 1-2 days.
Bearish View
Set a sell-stop at 1.3800 and a take-profit at 1.3700.
Add a stop-loss at 1.3900.
The GBP/USD price rebounded on Wednesday after the relatively mild US inflation data. The pair rose from this week’s low of 1.3800 to a high of 1.3863.
US Inflation and UK GDP
The GBP/USD pair rose after the US published the July Consumer Price Index data. According to the Bureau of Labor Statistics (BLS), the headline CPI rose by 5.4% on a year-on-year basis. This was the same level it was in June and the highest level in more than 13 years. The prices weakened on a month-on-month basis as it dropped from 0.9% to 0.5%.
Meanwhile, core consumer inflation declined from 4.5% in June to 4.3% in July. It also fell from 0.8% to 0.3% on a month-on-month basis. These numbers are substantially higher than the Fed’s target of 2.0%. Still, they signal that the Fed was right when it predicted that the pace will start slowing down.
The mild inflation data came two days after data revealed that the US vacancy rate soared to more than 10 million in July. They also came a few days after the US published the relatively strong employment numbers that revealed that the economy added more than 943k jobs in July and the unemployment rate declined to 5.3%.
Meanwhile, the US inflation data came as the country battles with the new wave of coronavirus. Yesterday, Southwest Airlines said that it had started seeing a slowdown in bookings and cancellations as the numbers rise. Other companies like restaurants and hotels are also expected to see some slowdown.
The GBP/USD will next react to the latest UK GDP numbers that will come out in the morning session. Data by the Office of National Statistics (ONS) is expected to show that the economy rebounded by 4.8% on a QoQ basis and 22.1% on a year-on-year basis as the country reopened.
GBP/USD Technical Analysis
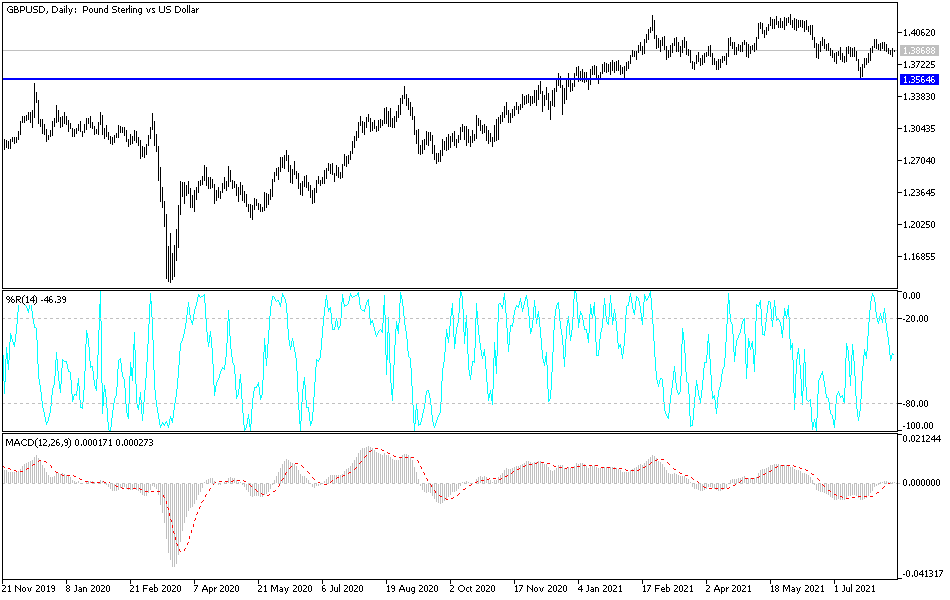
The four-hour chart shows that the GBP/USD declined below the lower side of the bullish flag on Wednesday. It then rose above this level after the latest US inflation numbers. A bullish flag is usually a sign that a previous bullish trend will continue.
The price is also at the same level as the 25-period and 50-period moving averages. The two lines of the MACD indicator have also moved below the neutral level. Still, because of the pennant pattern, the pair will likely break out above the upper side of the flag after the UK GDP data.

