Bullish View
Set a buy-stop at 1.3880 and a take-profit at 1.3950 (bullish flag).
Add a sell-stop at 1.3800.
Timeline: 1-2 days.
Bearish View
Set a sell-stop at 1.3820 and a take-profit at 1.3750.
Add a stop-loss at 1.3900.
The GBP/USD pair retreated after the strong American vacancies data and as US bond yields rose. The pair fell to a low of 1.3850, which was the lowest level since July 27.
Strong US Rebound
The US economy has staged an impressive rebound in the past few months. This growth has been helped by the latest vaccination rate in the country coupled by the easy-money monetary policy by the Federal Reserve and the substantial stimulus by Congress.
Since the pandemic started, Congress has allocated more than $6 trillion in fiscal stimulus while the Fed has maintained low-interest rates and launched its biggest bond-buying program on record.
As a result, the labour market is booming. Data published on Monday showed that the country is facing its biggest labor shortage on record. The numbers by the Bureau of Labor Statistics showed that the economy has more than 10 million vacancies, which is the highest it has been on record.
Still, data published on Friday showed that the American economy is yet to fill millions of jobs that were lost during the COVID pandemic. Therefore, there is a likelihood that companies will continue adding millions of workers in the next few months even as the pandemic risks remain.
Looking at the economic calendar, there is no major economic event scheduled that will have an impact on the GBP/USD. Therefore, investors will keep focus on the upcoming US inflation numbers scheduled for Wednesday and the UK GDP numbers that are scheduled for Thursday this week.
Analysts believe that the country’s inflation remained being elevated in July as prices of most commodities rose. The median consensus is that inflation rose above 5% for the second consecutive month. Meanwhile, the GBP/USD will also react to the latest UK GDP numbers, which are expected to show that the economy rebounded in the second quarter.
GBP/USD Technical Analysis
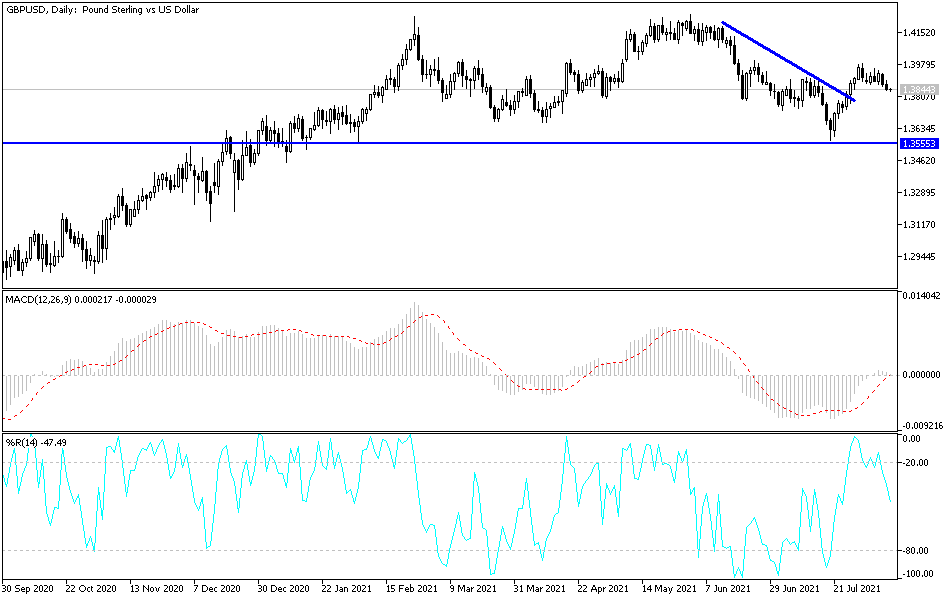
The two-hour chart shows that the GBP/USD pair has been in a strong bearish trend in the past few days. As a result, it has fallen below the 25-day and 50-day moving averages. This is a bearish signal. However, a closer look shows that it has formed a bullish flag pattern that is shown in black. In price action, this pattern is usually a bullish view. Therefore, the pair will likely resume the bullish trend ahead of the UK GDP and US inflation data.

