Bullish View
Buy the GBP/USD and add a take-profit at 1.3915.
Add a stop-loss at 1.3750.
Timeline: 1-2 days.
Bearish View
Sell the GBP/USD and add a take-profit at 1.3700.
Set a stop-loss at 1.3900.
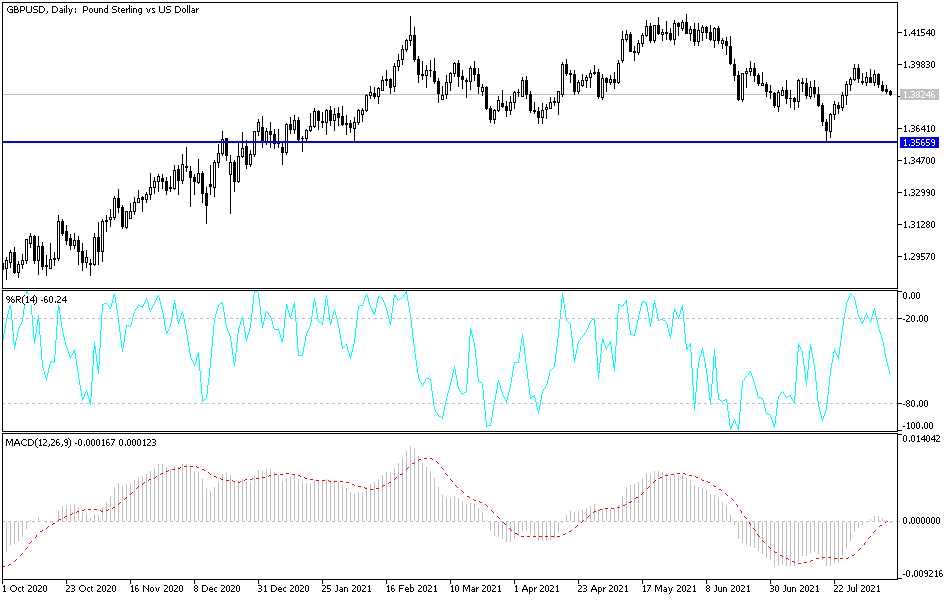
The GBP/USD price declined slightly overnight after the US Senate passed the $1 trillion infrastructure package. The pair declined to 1.3835, which was about 1% below the highest level last week.
US Infrastructure Bill
The Senate concluded its debate on the $1 trillion infrastructure bill on Tuesday. The bill will see the country spend these funds to fund key infrastructure projects, including building roads and bridges.
Funds have also been allocated to build broadband and infrastructure to support the decarbonization of the US. Still, the bill faces an uncertain future in the House of Representatives where some Democrats have argued that it did not go far enough.
While the infrastructure bill is an important step, its impact on the US economic growth will be muted. For one, this bill will be implemented in a ten-year period, which is a relatively long period. Besides, the government has already provides stimulus worth more than $6 trillion in the past 15 months. Further, half of these funds will be repurposed from the previous stimulus packages.
The GBP/USD will next react to the latest US inflation numbers. Data by the Bureau of Labor Statistics (BLS) is expected to show that the headline CPI tilted lower from 5.4% in June to 5.3% in July. The core consumer inflation that excludes the volatile food and energy prices is expected to drop from 4.3% to 4.2%.
The pair is wavering as data showed that the UK economic growth was starting to normalize. Yesterday, data by the British Retail Consortium (BRC) showed that sales declined to 4.7% in August from 6.3% in the previous month. Other numbers like house prices and PMIs have showed that the robust recovery path is flattening. The GBP/USD will also react to the latest UK GDP numbers scheduled for tomorrow.
GBP/USD Technical Analysis
The GBP/USD remained under pressure as shown on the 4H chart below. The pair is trading along the lower side of the bullish flag pattern shown in black. The Relative Strength Index (RSI) has also been moving on a downward trend since July 29. It has also moved below the 25-day and 50-day moving averages.
The pair’s bullish flag and the fact that the RSI is moving towards the oversold level signals that the pair will likely rebound in the near term. If this happens, the next reference level will be at the upper side of the flag at 1.3915.

