Bullish View
Buy the GBP/USD and add a take-profit at 1.3985.
Add a stop-loss at 13700.
Timeline: 1-2 days.
Bearish View
Set a sell-stop at 1.3830 and a take-profit at 1.3732.
Add a stop-loss at 1.3930.
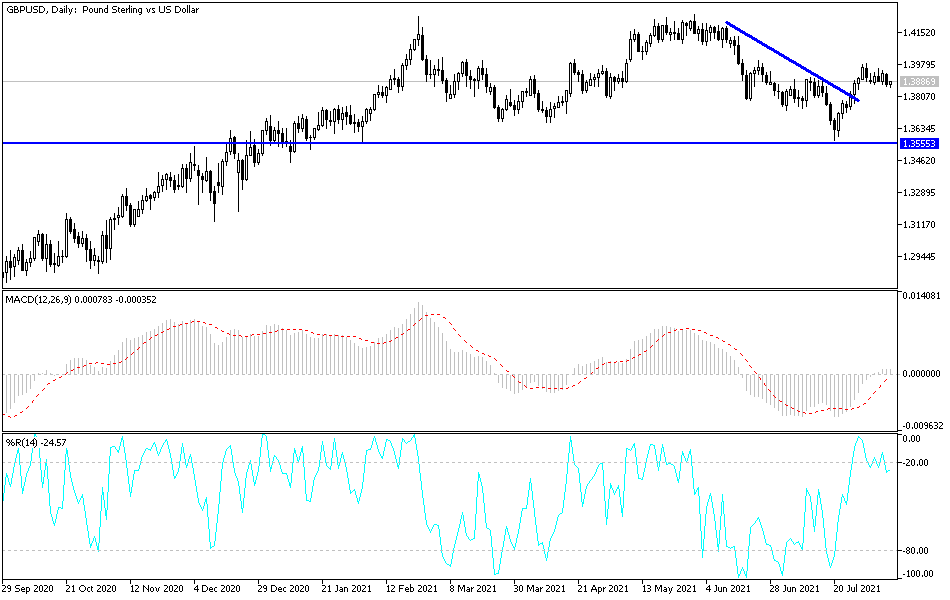
The GBP/USD tilted lower after the strong US employment numbers that were published on Friday. The pair dropped to 1.3862, which was the lowest level since 28th July.
US Jobs Numbers
On Friday, the US Bureau of Labor Statistics (BLS) published the July employment numbers. The data showed that the American economy added 943,000 jobs in July, signaling that the economy was rebounding well. The number was better than the ADP estimate of just 330,000.
It was also the biggest monthly increase since the economy added more than a million jobs in August last year. Still, the economy is short of more than 5.7 million jobs that it lost early during the pandemic. The unemployment rate declined to a post-pandemic low of 5.3% while wages rose by 4.0%.
These numbers were bullish for the US dollar because they signal that the Federal Reserve could shift its monetary policy. Furthermore, inflation is also significantly above the Fed’s target of 2.0%. Later this week, the government will publish the latest inflation data. Analysts expect that the headline CPI cooled from 5.4% in June to 5.3% in July.
The GBP/USD is also reacting to the new infrastructure package in the US. The Senate passed the initial stages of the $1 trillion stimulus package during the weekend. This package will see the country build new roads and bridges while simultaneously investing in clean energy infrastructure projects.
Still, the overall impact to the economy will be limited, according to economists interviewed by the Wall Street Journal. They cite the fact that the bill only has $550 billion in new spending. This compares to the $6 trillion that Congress has allocated in the past 12 months. Further, the project will be implemented in a ten-year period, which is a longer period.
GBP/USD Technical Analysis
The GBP/USD has been under pressure in the past few days. The pair declined to 1.3865, which was substantially lower than last week’s high of 1.3950. On the four-hour chart, the pair has formed a bullish flag pattern and is between the 50% and 38.2% Fibonacci retracement levels. It is at the lower side of the bullish flag pattern. Therefore, the pair will likely rebound ahead of the latest US inflation and UK GDP data scheduled later this week. The key level to watch will be the 61.8% retracement at 1.3985.

