Bullish View
Buy the GBP/USD pair and add a take-profit at 1.4100.
Add a stop-loss at 1.3800.
Timeline: 1-2 days.
Bearish View
Set a sell-stop at 1.3850 and a take-profit at 1.3700.
Add a stop-loss at 1.3950.
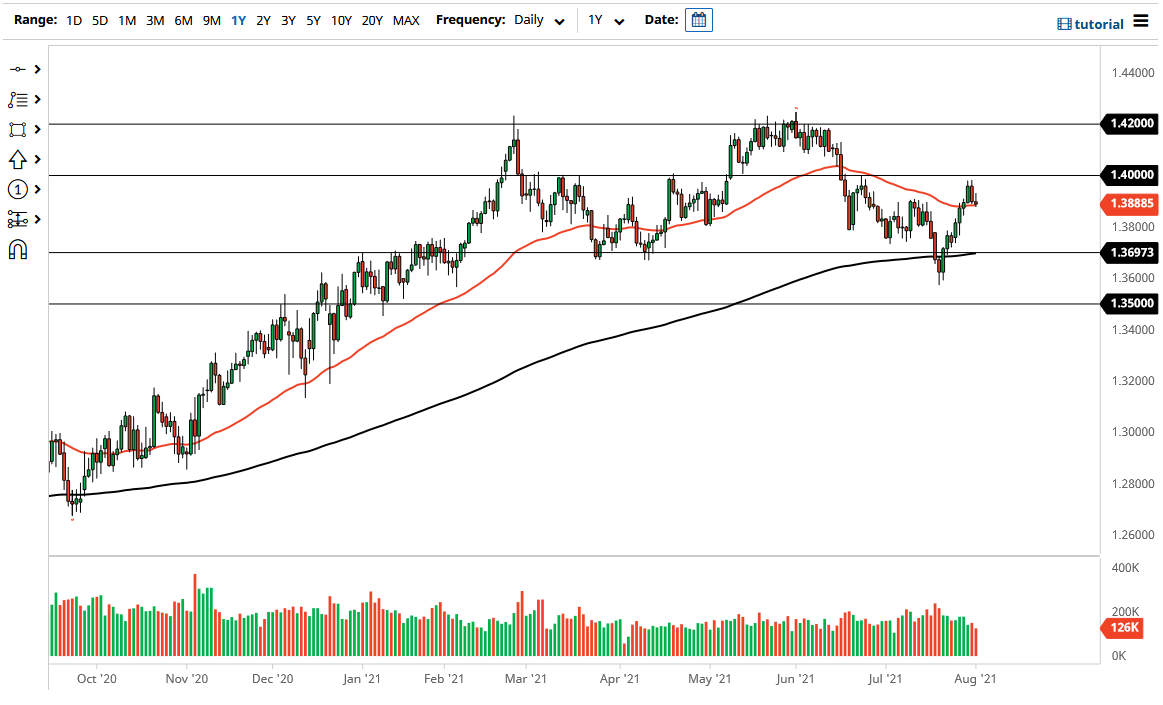
The GBP/USD pair retreated slightly after the relatively mixed manufacturing data from the US and UK and as worries of the Delta variant remained. The pair declined to 1.3892, which was slightly below last week’s high of 1.3983.
UK and US Manufacturing
The manufacturing sector has done relatively well during the COVID pandemic. On Monday, data by Markit showed that the UK Manufacturing PMI declined from 63.9 in June to 60.4 in July. This was in line with what analysts were expecting. A PMI reading of 50 and above is a sign that a sector expanded.
In the US, data by Markit revealed that the Manufacturing PMI rose from 62.1 in June to 63.4 in July. Economists were expecting the PMI to rise to 63.1. Further data by the Institute of Supply Management (ISM) showed that the Manufacturing PMI declined from 60.6 to 59.5.
These numbers showed that manufacturers in the US and UK were seeing strong demand, which pushed them to increase their workers. Still, they are seeing higher cost pressures and supply issues as the global shipping logjam remains.
This week, the top catalysts for the GBP/USD will be the upcoming Bank of England (BOE) interest rate decision and the US non-farm payrolls (NFP) data. The BOE is expected to leave interest rates unchanged when it meets on Thursday. There is also a possibility that it will maintain its quantitative easing policies unchanged as the UK sees a new wave of the virus.
The US Labor Department will publish the latest employment numbers on Friday. With the services sector reopening, there is a possibility that the country added more than 900,000 in July after it added more than 850k jobs in June. The unemployment rate is expected to fall to 5.7%.
GBP/USD Forecast
The GBP/USD pair rose to a high of 1.3983 last week. It then retreated as investors refocused on the upcoming BOE decision and US jobs data. It is hovering at the 25-day and 15-day moving averages while the two lines of the MACD have made a bearish crossover. The pair is forming what looks like an inverted head and shoulders pattern, which is usually a bullish signal. Therefore, there is a possibility that it will rebound as investors target the next key resistance level at 1.4100.

