Bullish View
Buy the GBP/USD and set the take-profit at 1.4050.
Add a stop-loss at 1.3800.
Timeline: 1-2 days.
Bearish View
Set a sell-stop at 1.3800 (50% retracement level).
Add a take-profit at 1.3700.
The GBP/USD price darted higher on Monday morning as investors prepared for what will be a relatively busy week for the UK and the US. The pair rose to 1.3870, which was about 0.56% above the lowest level last week.
UK and US Data
The GBP/USD rose on Friday after data from Michigan University showed that US consumer confidence declined to the lowest level since 2011 as fears of the Delta variant rose. The data came a day after the US published strong Producer Price Index (PPI) and initial jobless claims numbers.
This week, focus shifts to key economic numbers from the UK and the US. On Tuesday, the Office of National Statistics (ONS) will publish the June UK employment numbers. Analysts expect that the country’s unemployment rate declined in June as the country ended most of its lockdowns. They also expect that wages continued rising.
These numbers will be followed by the latest UK Consumer Price Index (CPI) data that will come out on Wednesday. In general, analysts expect that consumer prices moderated slightly in July. They expect that the headline CPI declined from 0.5% in June to 0.3% in July. This, will in turn push the year-on-year inflation from 2.5% to 2.3%.
Meanwhile, the core CPI is expected to drop from 0.5% to 0.2% and from 2.3% to 2.2% on a year-on-year basis. As such, there is a likelihood that the CPI will oscillate above the Bank of England target of 2.0% for three straight months. In its most recent decision, the bank predicted that the CPI will peak to about 3% and then normalize to about 2%.
The final important number will be the UK retail sales that will come out on Friday. Elsewhere, the US will publish the July retail sales numbers on Tuesday, building permits on Wednesday, and Philadelphia Manufacturing Index on Thursday. The Fed will publish the minutes of the last meeting on Wednesday.
GBP/USD Technical Analysis
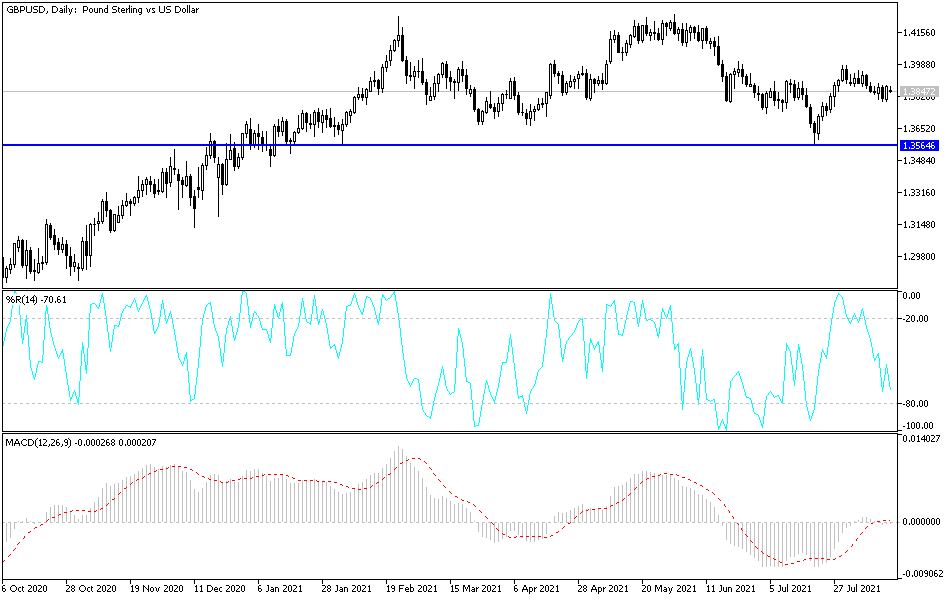
The GBP/USD has been in a downward trend in the past few weeks. As a result, it has formed a descending channel. A closer look shows that this channel is part of the pair’s bullish flag pattern. The pair has also formed an inverted head and shoulders pattern, which is usually a bullish sign. The neckline level of this pattern is at 1.400.
Therefore, there is a likelihood that the pair will break out higher this week. If this happens, the next key reference point will be at 1.4000. However, a drop below the 50% Fibonacci retracement level at 1.3786 will invalidate the bullish view.

