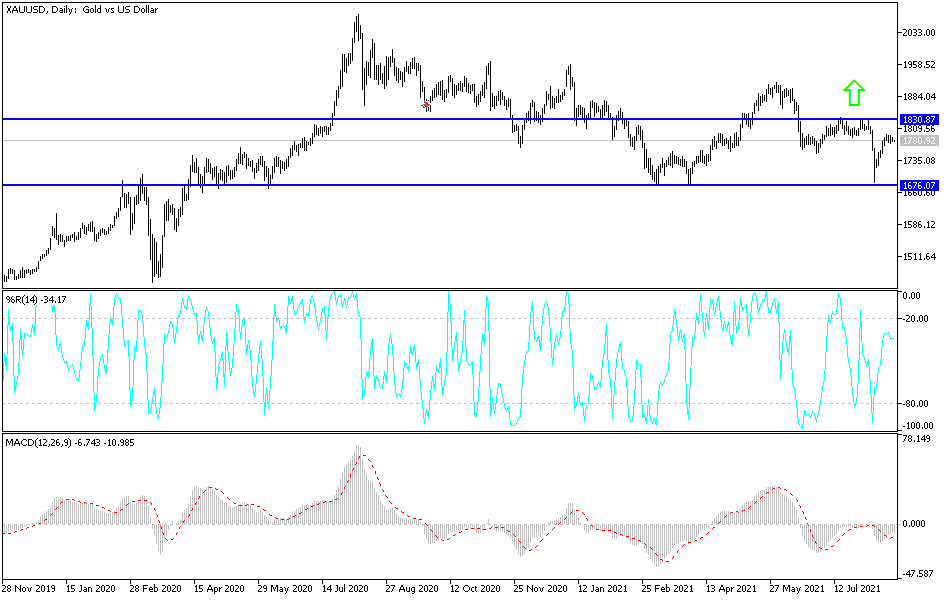
Gold markets fluctuated on Friday as we ended up forming a bit of a shooting star. Ultimately, the 50-day EMA above has offered quite a bit of resistance and it suggests that the market cannot break out to the upside anytime soon. What is interesting is that the weekly candlestick from last week was a hammer, and now we did up forming a very quiet one. It is almost as if the market is trying to figure out whether or not we can continue any type of momentum.
The 50-day EMA offers resistance, but then we also have the 200-day EMA sitting just above there. Looking at this chart, the area between those two moving averages will offer a significant amount of resistance, as the 200-day EMA currently sits at the $1804 level. If we break above the 200-day EMA, then the market is likely to go looking towards the $1830 level. That is an area that I think continues to see a bit of selling pressure, but if we were to break above there then it could turn the market around completely, perhaps opening up the possibility of a move towards the $1910 level.
More likely than not, we will break down below the lows of the week and go looking towards the $1750 level. That is an area that has previously been support, and I think a certain amount market memory will come into the picture there. If we break down below that level, then it will probably open up a move down towards the $1680 level. That is an area that has been massive support at least three times, so I think at this point if we break through that level it would be a massive turn of events, as it could open up a bit of a meltdown in the market. That would probably coincide with massive US dollar strength, which has a major negative correlation to this market. Pay attention to the US Dollar Index, as it is a fairly reliable indicator of where the gold markets will go over the next few weeks. Beyond that, pay close attention to the 10-year note in the United States, because if yields rally, that will also work against the value of gold.

