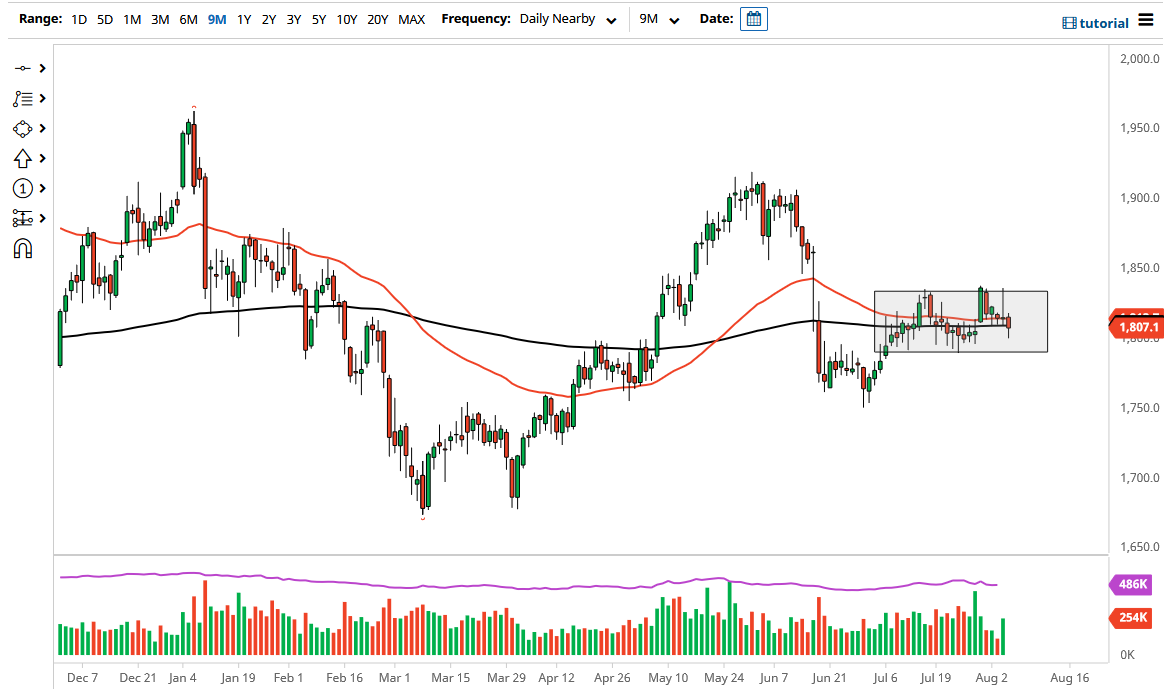
However, we have turned around and showed signs of life again, and at this point in time it looks as if the market is going to continue to stay in the gray box that I have painted on the chart, with the $1790 level underneath offering support, and of course the $1830 level offering resistance. By the end of the day on Friday, we will have gotten through the jobs figure, but ultimately it will be interesting to see whether or not we are still in this consolidation area.
I do believe at this point in time we are going to have to wait to see whether or not the jobs number will be enough to make this market break out. If we break above the top of the range, then it is likely that we go looking towards the $1860 level, which is the top of the gap on the chart, and it should show a certain amount of resistance. On the other hand, if we were to break down below the bottom of the box at the $1790 level, the market would then more than likely drop towards the $1750 level, an area that we have bounced from rather significantly.
By bouncing the way we have, it does suggest a certain amount of strength, but when you look at this chart you can also make an argument that there are still a lot of uncertainties out there, especially when you look at the Wednesday candlestick that formed a massive rejection from the top of the box. Whether or not the jobs number is reason enough to get out of this range is a completely different question and obviously we will have to wait to see how that plays out. Because of this, I think that the market continues to consolidate in this relatively tight range and short-term traders will probably continue to look at this through that prism, with the possibility of the market eventually taking off in one direction or the other. In other words, this is essentially a “two speed market”, which short-term traders knocking the ball around, while longer-term traders are simply looking for some type of signal to latch onto.


