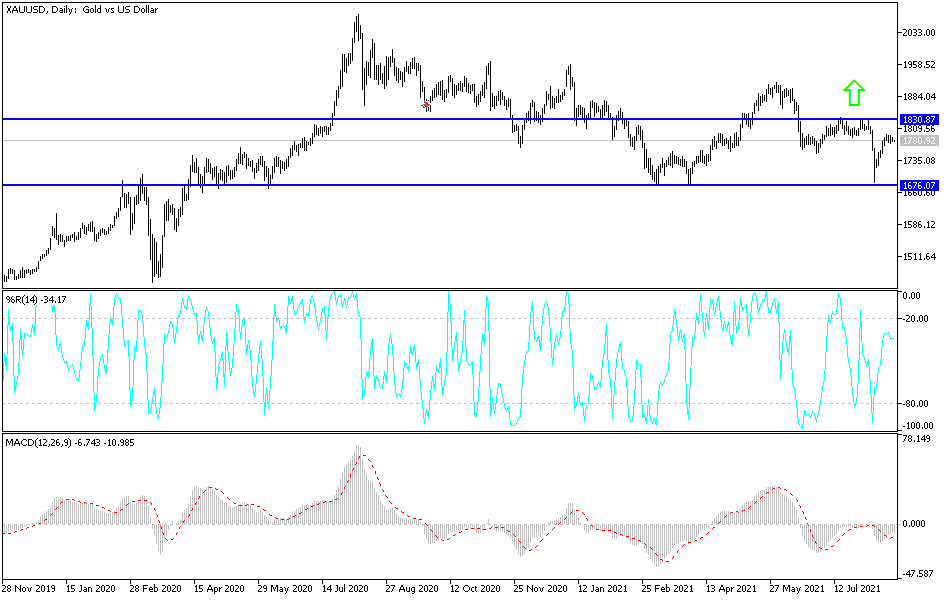
Gold bulls are waiting for a decline in the US dollar to shoot past the psychological resistance of $1800. The USD is strengthening due to the Delta variant posing a direct danger to global economic recovery, in contrast to the optimism since the beginning of the year. This week will see the Jackson Hole symposium, which will likely determine direction for the US dollar and therefore the gold market. This event will indicate the future of the Federal Reserve's tightening policy. Strong movements will occur in the global financial markets in general and the gold market in particular.
On the economic side, gold is affected by slowing stock market activity due to the delta variant and closing of the second quarter earnings season. However, US economic data last week brought back some optimism in the dollar, which pushed gold lower against the US dollar. According to official figures, the US initial jobless claims for the week ending August 13th exceeded the expected number of claims at 363K with the announcement of 348K. However, continuing claims came in higher than expected at 2.82 million versus 2.80 million. On the other hand, the Philadelphia Fed Manufacturing Survey for the month of August forecast a reading of 23 with a record of 19.4.
Also, US building permits for June beat expectations while housing starts came in below estimates. On the other hand, US retail sales for July missed expectations on all fronts.
Fund managers are not expecting much volatility this month as investors will have little data to sway. August also tends to be a popular time for investors to go on holiday, so trading volume usually decreases. September tends to be a more volatile month once Wall Street gets back to work. However, this week may provide Wall Street with more insight into what the Fed might do about inflation. Last week, minutes from the Federal Reserve's latest meeting showed that officials discussed scaling back the central bank's bond-buying program later this year to begin winding down some of the emergency measures implemented during the pandemic. But they didn't get to set a fixed timetable for working on it.
Technical analysis of gold prices
In the near term and according to the performance of the hourly chart, it appears that gold is trading within the formation of a descending channel. This indicates a slight short-term bearish momentum in the market sentiment. The gold price has now broken below the 100-hour moving average. Therefore, the bears will look to extend the current downside move towards $1,771 or below to the $1,759 support level. On the other hand, the bulls will target potential bounces around $1,790 or higher at $1,802 an ounce.
In the long term, and according to the performance on the daily chart, it appears that the price of gold is trading within the formation of a descending channel. The yellow metal has recently bounced off its current yearly lows around $1,677. This indicates that the bulls are trying to regain control. Therefore, they will target earnings for an extended recovery around $1,811 or higher at $1,842 an ounce. On the other hand, the bears will target long-term profits at around $1,745 or lower at $1,709 an ounce.
The price of gold today will be affected by the level of the US dollar, the level of risk appetite, and the reaction of investors to the PMI readings for global economies.


