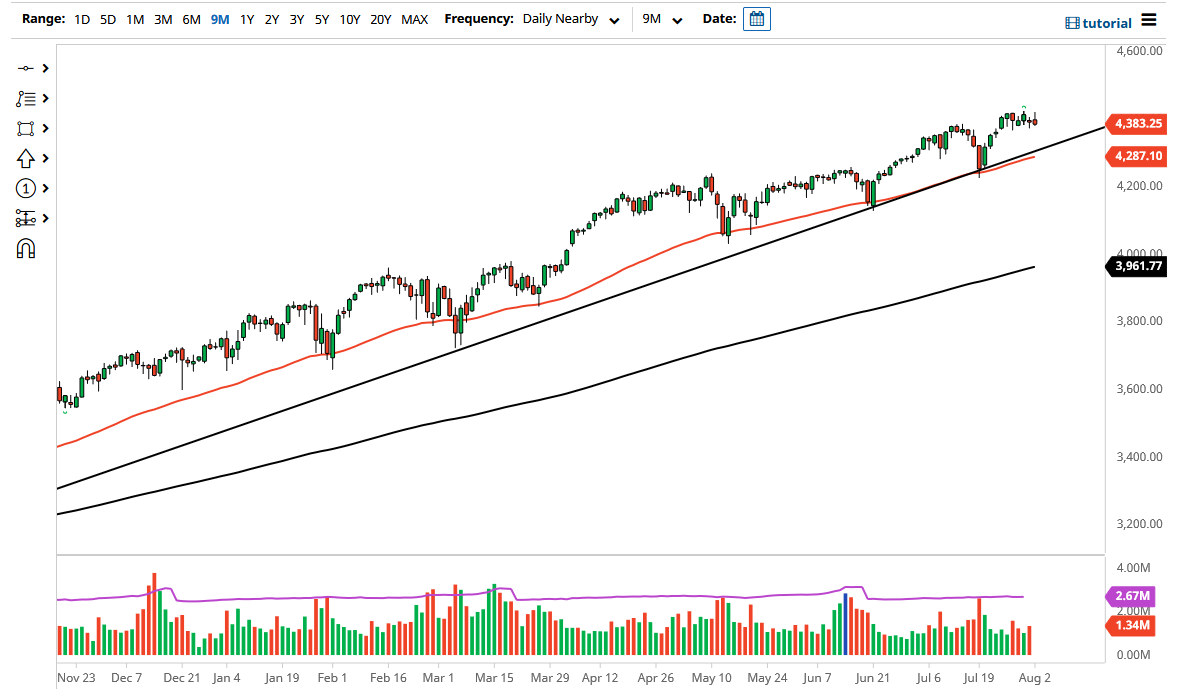
The S&P 500 initially tried to rally during the trading session on Monday but then gave back all of the gains to form a shooting star. At this point, the market is likely to see buyers underneath them, but it certainly looks as if we are a bit cautious. Ultimately, when you look at this chart, it looks as if the 50-day EMA and the uptrend line both come into the picture to show signs of life. That is a trend-defining circumstance, so as long as we are above that level, then I think you have to assume that the buyers are close. On the other hand, if we were to break down below the uptrend line and the 50-day EMA, then we could go looking towards the 4200 level.
Underneath, if we break down below the 4200 level, then it is possible that we could go looking towards the 4000 level. The 4000 level is an area where there is a small gap that could come back into the picture, and will attract a lot of attention from a psychology standpoint. The 200-day EMA is also reaching towards that area, so it makes sense that we will continue to see a bit of a push in that general vicinity.
If we were to break down below the 200-day EMA, then it is possible that we may get a little bit of a deeper correction, but if we do drop down towards that area, it would be a 10% correction, which is standard and run-of-the-mill. In general, I do not like shorting this market, but I also recognize that we might get a little bit of a pullback as we are starting to show signs of exhaustion. Ultimately, it is only a matter of time before the buyers come back in, so if this market does drift a bit lower, I will simply wait until I get that supportive daily candlestick that is needed. If we can break above the highs of the last couple of days, then we can take out the 4400 level and go looking towards the 4500 level, which I do think will happen given enough timeut . But it may take some type of event, perhaps the jobs number on Friday.

