Bearish View
Set a sell-stop at 0.7240 and a take-profit at 0.7100.
Add a stop-loss at 0.7350.
Timeline: 1-2 days.
Bullish View
Set a buy-stop at 0.7300 and a take-profit at 0.7400.
Add a stop-loss at 0.7250.
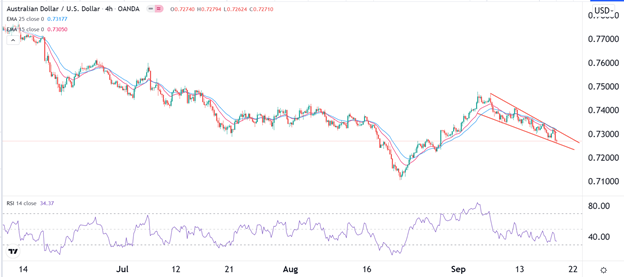
The AUD/USD pair declined sharply as investors continued watching the falling iron ore prices. The pair declined to 0.7270, which was the lowest level since August 27.
Iron Ore Prices Crash
Australia is a leading mining company, making the Aussie one of the leading commodity currencies. Therefore, the currency has tumbled in the past few weeks because of the falling iron ore prices. The price continued the declines that happened last week, when the metal declined by 22%. That marked its worst performance since 2008 at the height of the Global Financial Crisis.
The recent decline of iron ore price is mostly because of Chinese policies. In its economic modelling, the Chinese government has said that it intends its vast steel industry to hold production flat at about 1 billion tons this year in a bid to slow the industry. The new policies pushed the country’s steel mills to panic sell with the goal of reducing inventories.
There are also rising tensions between Australia and China after the government entered into a deal with the United States and the UK on submarine development. Another reason is the ongoing crisis at Evergrande, which could see banks limit lending to other lenders.
The Evergrande crisis has also pushed investors to safe-havens, such as the US dollar. Analysts believe that its failure could lead to contagion around the world.
The AUD/USD pair also declined as investors waited for the upcoming Federal Reserve decision and housing data from the United States. The Fed is expected to leave interest rates unchanged and possibly hint at tapering of asset purchases later this year. Besides, data from the country have been relatively positive in the past few weeks, with retail sales rising as the unemployment rate falls.
AUD/USD Forecast
The AUD/USD pair has been in a bearish trend in the past few weeks. It has declined by more than 2.8% from its highest level this month. At the same time, it has formed what looks like a falling wedge pattern on the four-hour chart.
A falling wedge is usually a bullish sign. It has also moved below the 25-day and 50-day moving averages while the Relative Strength Index (RSI) has moved slightly above the oversold level. Therefore, while the bearish trend may continue, a bullish rebound cannot be ruled out.

