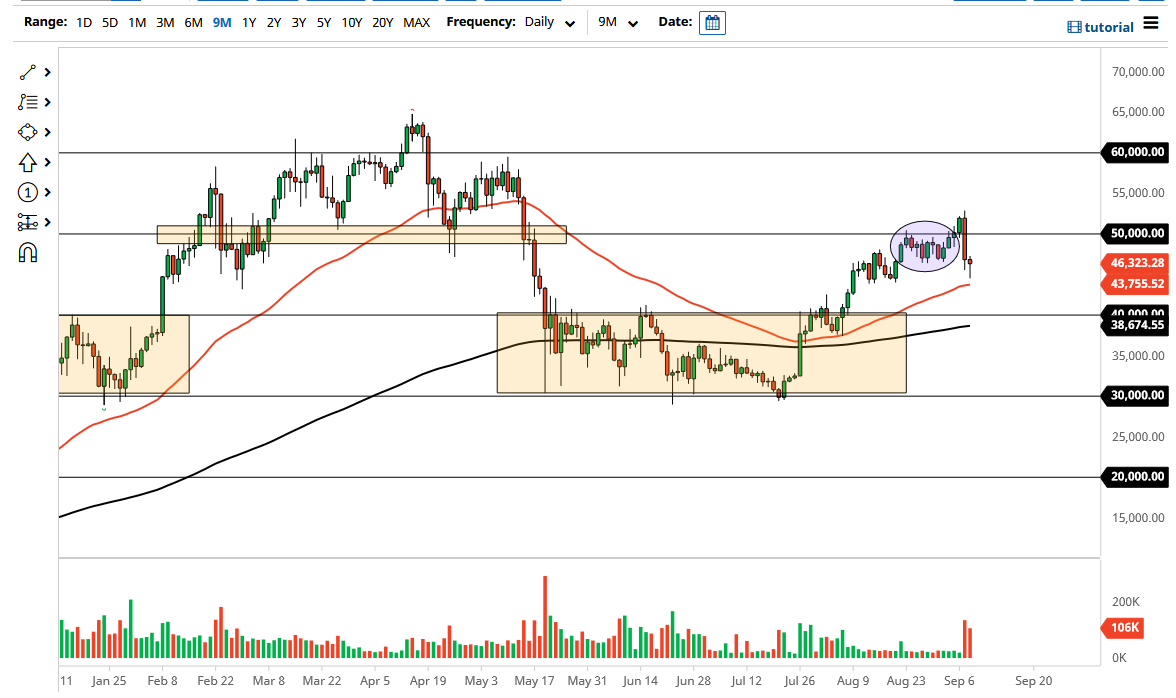
The Bitcoin market fell again on Wednesday but then showed signs of life again as the 50-day EMA has offered a significant amount of support. By doing so, the market ended up forming a bit of a hammer, which of course is a bullish sign. With that being the case, the market is likely to try to recover at this point, and a break above the top of that hammer candlestick is a bullish sign.
That being said, the market is likely to see the turnaround as a bullish sign, although you should keep an eye on that massive engulfing candlestick that kicked all of this off. After all, the huge candlestick suggests that there is real concern, but at this point one would have to think that eventually technical traders will get involved. We need to take out the top of the candlestick from the session on Tuesday to get overly bullish, so between now and then it is going to be difficult to put a big position on. Quite frankly, the only people jumping in right now with big positions are the ones who believe in the overall “hold” theory.
If we break down below the 50-day EMA, then I suspect that Bitcoin will go looking towards the $40,000 level. That is an area that has been rather important a couple of times, and now it has the 200-day EMA reaching towards it, which in and of itself is a relatively good sign. When I look at this chart, I recognize that the $40,000 level was the previous consolidation top, so there should be a certain amount of market memory in that area. Because of this, I would be very interested in buying Bitcoin in that general vicinity, assuming that we get a bullish candlestick that suggests that there are buyers willing to jump in. If we break down below there, then things can get rather ugly for Bitcoin, and we could see a massive selloff. With this, I think that we have a couple of very interesting trading sessions ahead of us here in Bitcoin, but ultimately this is a market that has been very bullish for quite some time, so I assume that we will go higher, but it is not necessarily going to be easy.

