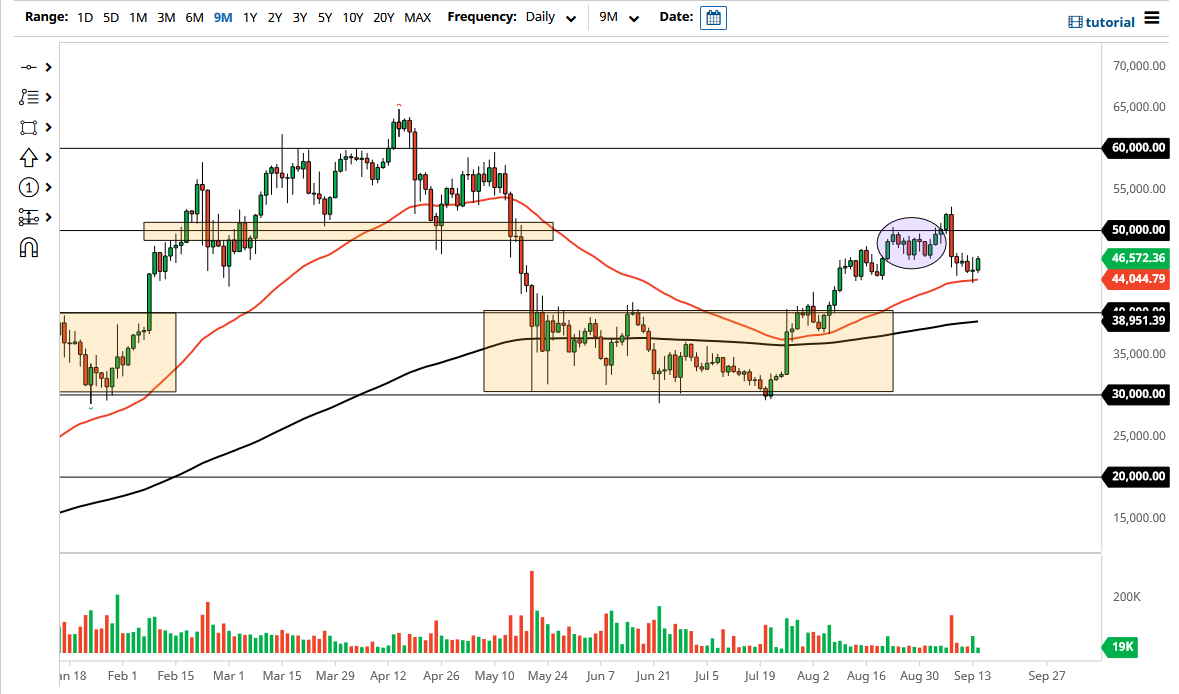
The Bitcoin market rallied a bit on Tuesday to show continued respect for the 50-day EMA which sits just below. After all, the market had reached towards the 50-day EMA during the trading session on Monday at the 44,000 level, and it should also be noted that the 50-day EMA is sloping higher. This is an indicator that a lot of people have been paying attention to, as we have seen such a significant reaction each time we touched it.
That being said, it looks as if the 47,000 level is offering a little bit of short-term resistance, but breaking above there, we could go looking towards the $50,000 level, an area that will attract a lot of attention due to the psychology of that region. Breaking above that level then opens up the possibility of a move towards the 52,000 level. Ultimately, that is the trade that I would anticipate kicking off, but at the end of the day we need to see some type of momentum to enter this market. The fact that the Tuesday candlestick closed towards the top of the range of the day typically means that we are going to go higher.
When you look at the chart, if we were to turn around and break down below the 44,000 level, then we could drop towards the 40,000 level underneath. The 200-day EMA is reaching towards the 40,000 level, which of course is a large, round, psychologically significant figure that a lot of people will be attracted to. That is an area that was previous resistance, and it makes sense that “market memory” would come into play at that point, and I would anticipate that the market would completely break down if we were to somehow break down below there.
This is a market that is bullish overall, and now I think we are starting to form a little bit of a “rounded bottom” in the market, which is a nice turnaround. That being said, it is obvious that the market has some work to do, but at this juncture I still believe that we will go higher over the longer term. Ultimately, pay attention to the US dollar because it can have its influence as well.

