Bearish View
Set a sell-stop at 43,400 and a take-profit at 40,000.
Add a stop-loss at 45,000.
Timeline: 1-2 days.
Bullish View
Set a buy-stop at 44,000 and a take-profit at 46,000.
Add a stop-loss at 42,000.
The BTC/USD price remained under pressure as demand for the cryptocurrency waned. The pair declined to 43,423, which was the lowest level since September 7. It was also about 18% below the highest point this month. Other cryptocurrencies like Ethereum, Cardano, and Stellar also declined.
Bitcoin Under Pressure
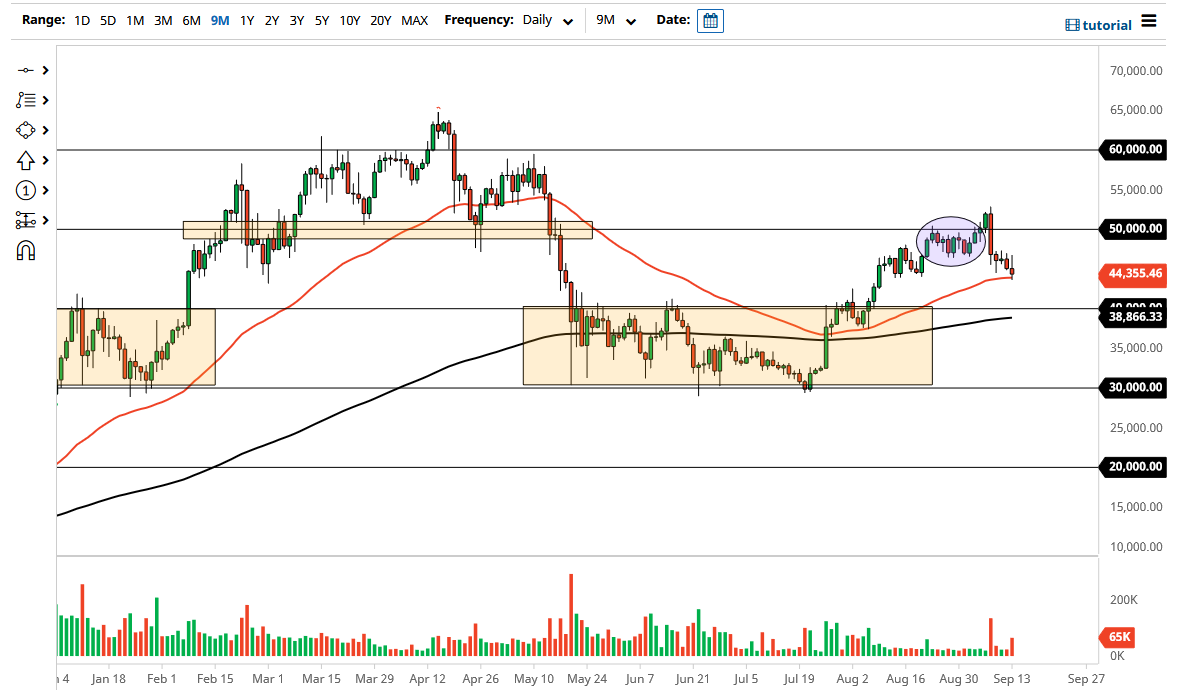
After staging a major comeback a few weeks ago, the BTC/USD pair has taken a breather. This performance is partly because of the strong resistance Bitcoin found after hitting its multi-month high of $52,000. Historically, Bitcoin tends to pull back a bit after making such a parabolic rally.
Bitcoin weakness also coincided with the strong comeback of the US dollar and the weakness of other markets. For example, US equities have been in a downward trend and many analysts believe that this performance will continue in the fourth quarter. Analysts at key banks like Deutsche Bank, Morgan Stanley, and Citigroup have all issued bearish signals of the market.
Meanwhile, there is also a likelihood of more regulations after a scam pushed Litecoin up by more than 30% on Monday. The scammers published a press release saying that Litecoin had reached a partnership deal with Walmart, the biggest retailer in the country. As a result, the coin jumped to a near four-month high and then erased some of those gains.
Another big news was that MicroStrategy, the technology company bought more Bitcoins recently. In a statement, the company’s CEO said that the firm had bought more Bitcoins worth $250 million. This makes the firm one of the biggest holders of Bitcoin in the world. At the same time, Cathie Wood of Arkk Fund intends to buy more Bitcoin ETFs from Canada.
Later today, the BTC/USD will react to the latest American inflation data. The numbers are expected to show that the country’s consumer prices remained above the Fed target of 2%.
BTC/USD Analysis
The four-hour chart shows that the BTC/USD has found a major support at 43,423. It struggled to move below this level overnight and last week. In theory, this should be a bullish factor for the pair. However, it also appears to have formed a bearish flag pattern, which is usually a bearish sign. It has also formed a small head and shoulders pattern.
Therefore, while a rebound is possible, the pair will likely break out lower soon as investors target the key support at 40,000.

