Bullish View
Buy the BTC/USD pair and add a take-profit at 51,000.
Set a stop-loss at 47,500.
Timeline: 2 days.
Bearish View
Set a sell-stop at 47,500 and a take profit at 46,000.
Add a stop-loss at 49,500.
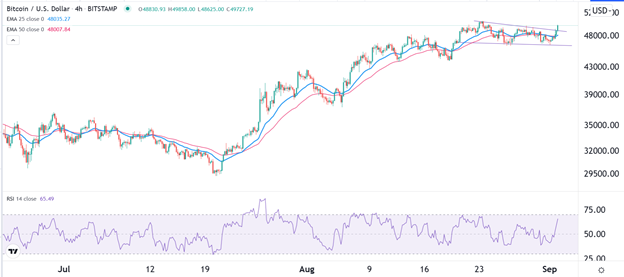
The BTC/USD price bounced back in the overnight session as demand for cryptocurrencies bounced back. The pair rose from this week’s low of 46,256 to a high of 49,860. Other cryptocurrencies like Ethereum, Cardano, and Litecoin also rose, bringing the total market capitalization of those tracked by CoinMarketCap to more than $2.2 trillion.
Bitcoin Bounces Back
The BTC/USD has been in a consolidation phase in the past two weeks as investors take profit after the recent spectacular rally. Besides, the coin’s price has risen by more than $20,000 in the past few weeks alone.
On Wednesday, Gary Gensler asked Congress to enact laws to shield consumers from the $2 trillion cryptocurrencies industry. In an interview with the Financial Times, he said that the industry needed some form of regulation to prevent investors from bad apples.
A common challenge is that it is unclear which agency should regulate what. For example, it is unclear whether products like XRP and BTC should be overseen by a different regulator. Similarly, it is still unclear whether companies like Coinbase should be regulated by the same regulators like Schwab and Fidelity.
The BTC/USD price rallied after the relatively weak US employment numbers from the US. According to ADP, the economy added about 374k jobs in August. This was a substantial decrease from the official numbers created in July. The data came a day ahead of the latest US initial jobless claims numbers and two days ahead of the official non-farm payrolls.
These numbers are notable for both Bitcoin and the US dollar because they send a signal of what the Federal Reserve will do. Significantly strong numbers will push the Fed to continue with the overall hawkish tone, which tends to be negative for cryptocurrency prices.
BTC/USD Technical Analysis
The BTC/USD pair jumped in the overnight session. On the four-hour chart, the pair has formed a bullish flag pattern. As it rose, it moved slightly above the upper side of this flag pattern. At the same time, it remains substantially above the 25-day and 15-day exponential moving averages (EMA) while the Relative Strength Index (RSI) has been rising.
Therefore, the pair will likely keep rising as bulls target last month’s high of more than $50,000. This view will be invalidated if the price moves slightly below the key support at $47,500.

