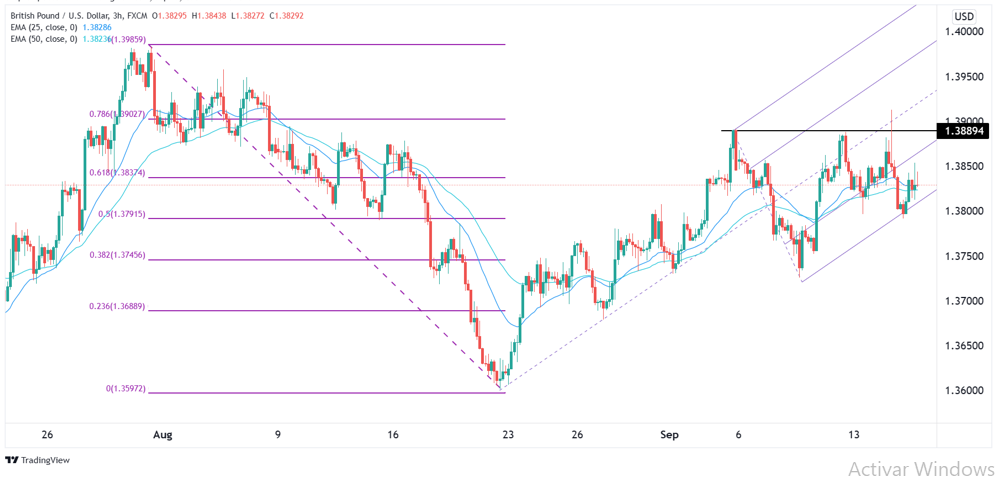
Bullish view
- Buy the GBP/USD and set a take-profit at 1.3900 (September high).
- Add a stop-loss at 1.3795.
- Timeline: 2 days.
Bearish view
- Set a sell-stop at 1.3795 and a take-profit at 1.3700.
- Add a stop-loss at 1.3900.
The GBP/USD pair tilted upwards in the overnight session as traders continued to reflect on the strong UK inflation and mixed US production numbers. The pair rose to a high of 1.3853, which was slightly higher than this week’s low of 1.3790.
Bank of England (BOE) Tapering?
The GBP/USD pair rose because of the divergence between the American and UK inflation data. On Tuesday, data by the Bureau of Labour Statistics (BLS) showed that the country’s inflation declined in August.
The headline CPI declined from 5.4% to 5.3% while core inflation fell from 4.2% to 4.0%. These declines were steeper than expected and were contributed by a sharp decline in airfares.
The situation was different in the UK, where prices made a strong rebound. The total inflation increased from 2.0% in July to 3.2% in August. This increase was higher than the median estimate of 2.9%. In the same period, core CPI, which excludes the volatile food and energy prices increased from 2.0% to 3.2%.
Still, this increase was attributed to the UK government’s Eat Out to Help Out program that happened in the same period in 2020. The program gave substantial discounts to people who went to eat out at restaurants, which lowered prices. As such, as the price rebounded this year since the government ended the program.
Higher prices in the UK also happened because of the relatively higher wages, commodity prices, and the overall cost of doing business.
Notably, the UK inflation data came a day after the UK published relatively strong jobs numbers. Therefore, analysts expect that the Bank of England will start tapering this year and then raise rates in 2022. The GBP/USD will next react to the American retail sales and initial jobless claims numbers scheduled for Thursday.
GBP/USD Forecast
The GBP/USD pair rebounded after the latest UK inflation data. The pair rose from a low of 1.3792 to the current level of 1.3835. On the three-hour chart, the price is slightly below the 61.8% Fibonacci retracement level. It is also along the 25-period and 50-period exponential moving averages (EMA).
At the same time, the price is below the key resistance level at 1.3890, where it struggled to move above this month. It is also between the first and second support levels of Andrew’s pitchfork tool. Therefore, the pair will likely remain in this range today.

