Bearish View
- Sell the GBP/USD and set a take-profit at 1.3600.
- Add a stop-loss at 1.3700.
- Timeline: 1-2 days.
Bullish View
- Set a buy-stop at 1.3700 and a take-profit at 1.3800.
- Add a stop-loss at 1.3600.
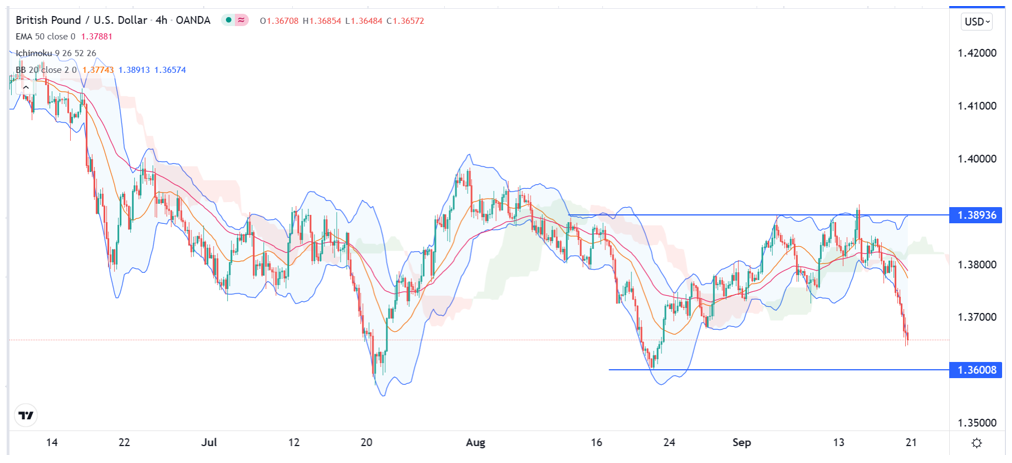
The GBP/USD sell-off accelerated in the overnight session as global tensions about Evergrande coupled with higher gas prices rose. The pair declined to a low of 1.3656, which was the lowest level since August 23rd. This price was almost 2% below the highest level this month.
UK Gas Prices Rise
There were three main catalysts for the GBP/USD in the overnight session. First, the pair declined as fear rose across the market. This fear was triggered by the recent crisis affecting the second-biggest real estate company in China.
The company is facing the challenge of making payments worth millions of dollars that are part of its $306 billion debt load. At the same time, the Chinese government has remained muted about any intervention, pushing investors to price-in default risks.
Second, the GBP/USD pair declined because of the rising gas prices in the UK. Gas prices rose by about 17% on Monday after Russia decided to cap additional flows to Europe. Gazprom, the state-owned company said that it will not push more gas through Ukraine in October. At the same time, there are signs that flow through the key Yamal-Europe pipeline will remain limited.
Therefore, there is a likelihood that the UK gas prices will keep rising ahead of the heating season in winter. As a result, unless the government intervenes, there is a possibility that inflation will keep rising and more energy companies will face going concern challenges. Some fertilizer companies have shut down operations.
The GBP/USD pair is also falling as traders anticipate a relatively hawkish Federal Reserve decision. The bank will start its meeting today and deliver its decision on Wednesday. This is will be an important meeting even though the Fed is not expected to tweak its interest rates and quantitative easing. Instead, the bank will provide a signal about its QE program.
GBP/USD Technical Analysis
The four-chart shows that the GBP/USD pair has been under intense pressure in the past few days. It has already declined by almost 2% from its highest level this month. It has also moved below the short and long-term moving averages.
Also, it has moved to the lower line of the Bollinger Bands and below the Ichimoku cloud. Oscillators like the MACD and Relative Strength Index (RSI) have also been on a downward trend. Therefore, the path of least resistance is to the downside, with the next key level to watch being at 1.3600.

