Bullish View
Set a buy-stop at 1.3810 and a take-profit at 1.3887 (R2).
Add a stop-loss at 1.3730.
Timeline: 2 days.
Bearish View
Set a sell-stop at 1.3730 and a take-profit at 1.3657.
Add a stop-loss at 1.3800.
The GBP/USD darted higher after the relatively mixed economic data from the UK and the US. The pair rose to a high of 1.3800, which was slightly higher than this week’s low of 1.3700.
UK Economy Holding Steady
Economic numbers published on Wednesday showed that the UK economy is doing relatively well as the country reopens. For example, data published by the Nationwide Society showed that the country’s housing market held steady as demand rose and supply tightened.
Analysts cite the recent stamp duty holiday and historically low mortgage rates. On Tuesday, data by the Bank of England revealed that more than 75k mortgages were approved in August.
Precisely, home prices rose by 2.1% in August after falling in the previous two consecutive month. This growth, in turn, led to an annualized gain of 11%. As a result, home prices have jumped by more than 20,000 pounds since the pandemic started.
Meanwhile, the UK manufacturing sector has done relatively better than what analysts were expecting. The Manufacturing PMI published by Markit rose to 60.3 in August, which was substantially higher than the expansion zone of 50. Still, there is a likelihood that the services sector, which accounts for the biggest part of the economy, declined during the month.
The GBP/USD price will react to the latest US initial jobless claims numbers that will come out later today. Analysts expect these numbers to show that the number of Americans filing for initial claims declined to 343k last week. This will be an improvement from the prior 373k.
The jobless claims numbers will come a day after ADP published weak private payrolls numbers. The data showed that the American economy added just 374k in August. Still, the ADP number tends to have a big divergence with the official NFP data that comes out on Friday.
GBP/USD Forecast
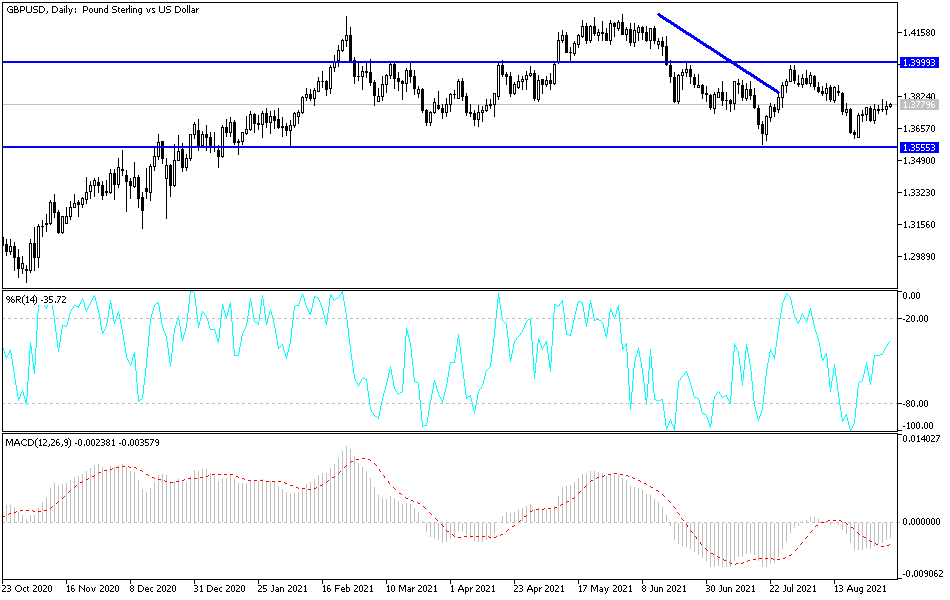
The 1H chart shows that the GBP/USD pair has been in a relatively bullish trend recently. It has formed an ascending channel and is currently slightly below the upper side of this channel. The pair is also slightly above the 25-period moving average and is slightly above the 61.8% Fibonacci retracement level. It is also between the pivot point and the first resistance of the standard pivot points.
Therefore, the pair will likely remain in this range as traders wait for the official NFP data. The key levels to watch will be the R2 at 1.3890 and the S1 at 1.3650.

