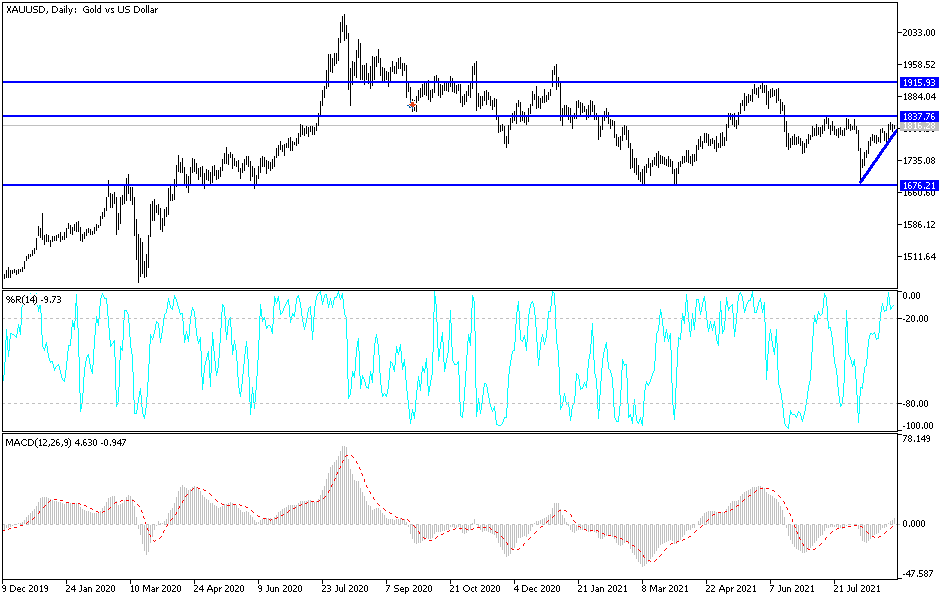
Gold markets fell a bit on Tuesday as we fell towards the 200-day EMA only to turn around and show signs of strength. That being said, there is still a significant amount of resistance above and I think that the level will be paid close attention to. If we can break above that level, then we could see a major breakout just waiting to happen. On the other hand, if we break down below the 50-day EMA we could see a significant pullback, which I look at as being roughly “50-50 odds” at this point in time.
The 50-day EMA and the 200-day EMA are both going sideways and flat, which suggests that perhaps the trend is a bit lost at the moment. If we can break above the $1835 level, then it is possible that we could go looking towards the $1865 level, followed by the $1910 level after that. On the other hand, if we were to break down below the 50-day EMA, which is hanging out at the $1800 level currently, the market is likely to go looking towards $1775 underneath. If we break down below that level, then $1750 becomes very likely to be targeted.
Make sure to keep an eye on the US dollar, because it will obviously have an influence on gold as per usual. There is a strong negative correlation between the two, and the correlation that the yield on the 10-year note has on this market should not be ignored either. The higher yields go, the more likely it is people are going to be buying bonds instead of buying gold, because there is a cost involved in storing gold, as opposed to simply locking up paper.
I think between now and the jobs number we are more likely than not to see sideways action, so I will be focusing on shorter time frame charts. However, I have a couple of clear levels which, if we can get above or below, I would become a bit more aggressive and perhaps a bit more long-term in my thinking. In general, this is a market that looks as if it is trying to build up enough pressure to break out, but it could just as easily roll over if the situation warrants that.

