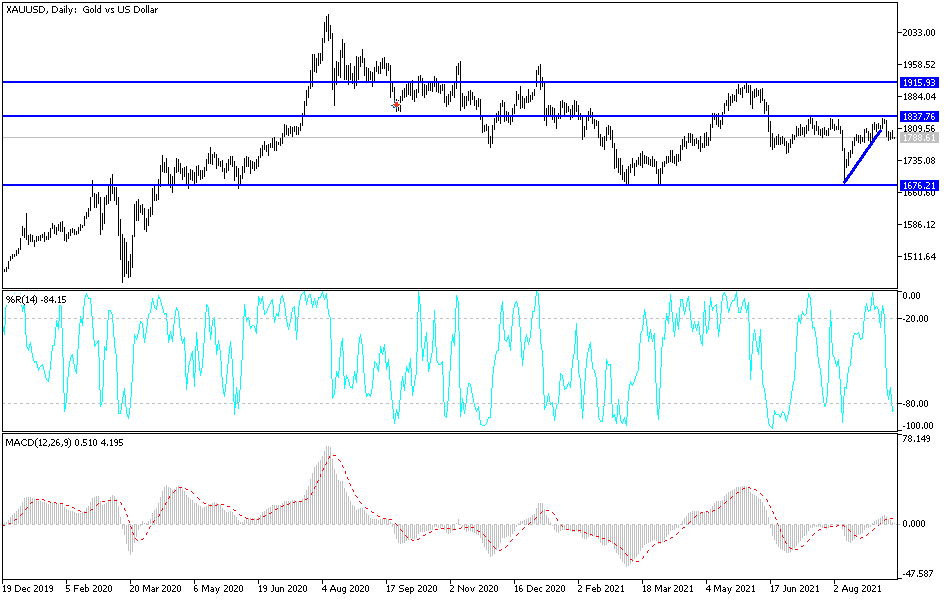
Throughout last week's trading, gold was subjected to selloffs due to risk appetite and the recovery of the US dollar. The selloff pushed gold to the $1783 support level. By the end of the week's trading, gold tried to recover above the psychological resistance of $1800, but the pressures brought it back to close around $1788. Gold halted its losses as investors and markets looked forward to news that the United States will pressure China over support, which dampened risk sentiment.
Accordingly, global stock markets gave up their gains as investors reduced their exposure following news that the Biden administration had launched a new investigation into Chinese subsidies and their damage to the US economy. Bloomberg reports that the move was a way to pressure Beijing over trade, raising concerns among investors that a deterioration in relations between the world's two largest economies is looming.
On the economic side, gold is trading weighed down by the recent US jobs numbers which came in with relatively disappointing results with the non-farm payrolls report and the ADP employment change for August that came out against expectations. On the other hand, PMIs for the manufacturing and services sectors beat estimates. However, calm prevailed last week with no significant developments apart from the initial jobless claims data and the PPI excluding food and energy, both of which beat expectations.
Therefore, the market did not have much to rely on apart from the events of the week before last. As a result, the price of gold pulled back from last week's gains made against a mixed batch of US data. Investors will be watching to respond to the challenges created by the delta variable for more market trends in the new week.
Investors were affected by the negative inflation data on Friday. Producer price inflation rose 8.3% last month from August 2020, the largest annual gain since the Labor Department began calculating the 12-month number in 2010. Accordingly, Fed policymakers said they believe US inflation this year will be temporary as a result of the economy recovering from the pandemic. However, persistently high inflation may force the Fed's hand to start rolling back its bond-buying program and low interest rate policy sooner than expected.
Gold technical analysis
In the short term, and according to the performance on the hourly chart, it appears that the price of gold is trading within the formation of a descending channel. It has recently retreated to form a reversal from the upside, pushing the gold price near the oversold levels of the 14-hour RSI. Therefore, the bears will be looking to extend the current losses towards $1,776 or lower to $1,763. On the other hand, the bulls will target potential short-term bounces at $1800 or higher at $1,812.
In the long term, and according to the performance on the daily chart, it appears that the price of gold is trading within the formation of a descending channel. The price of gold declined recently to avoid crossing over to the overbought levels of the 14-day RSI. Therefore, the bulls will target long-term profits at around $1,837 or higher at $1,896. On the other hand, the bears will look to extend the current decline towards the $1731 support or below to $1675.


