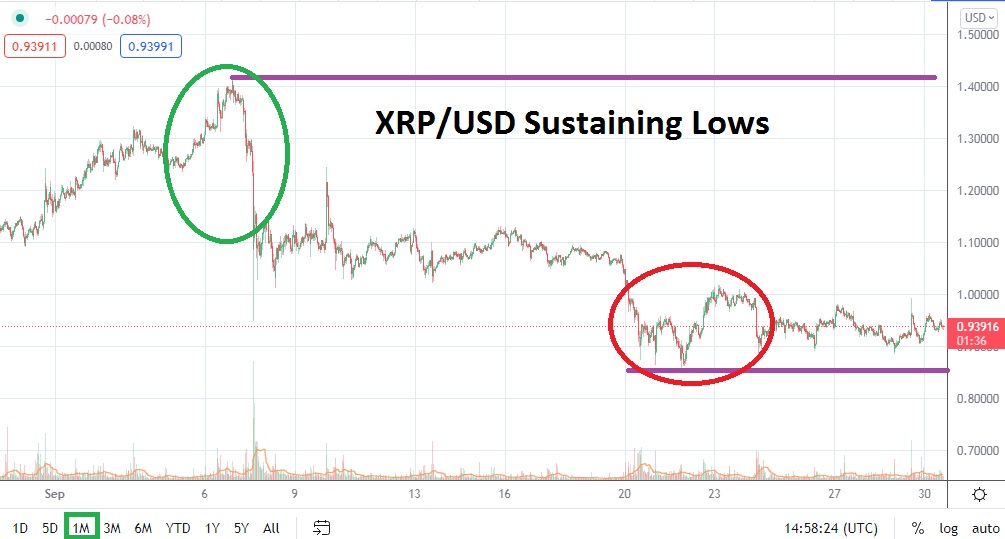
On the 7th of September, XRP/USD traded near the 1.40000 mark, this tested highs not seen since the 19th of May. However, traders who anticipated more bullish movement upwards were likely disappointed when Ripple began to selloff with a sharp reversal lower, which crushed support and essentially created a short-term value range between 1.11000 and 1.16000 for the next few days. After the 1.11000 mark faltered on the 15th of September, XRP/USD has incrementally challenged lower support.
As October gets ready to start, it appears XRP/USD will begin trading below the 1.00000 ratio. This level could prove important in the days and weeks to come. If the one-dollar mark is sustained as resistance and XRP/USD continues to correlate with the broad cryptocurrency market with negative sentiment, technically Ripple may find that it has additional downward motion that can develop. The past ten days of trading have seen XRP/USD test lows and touch the 90 cents ratio a handful of times. In fact, there have been a few times Ripple has touched the 88 cents mark and then produced slight reversals higher.
However, the reversals off of these lows recently tested have not produced much price velocity upwards, nor have the lower values attracted a massive groundswell of transactional volume in XRP/USD. The fresh lows and lack of trading volume neatly mimics the broad cryptocurrency market and indicates another round of selling pressure could emerge.
If the 1.00000 is not toppled soon and doesn’t produce a sustained value above this current short-term resistance level, speculators cannot be blamed for believing further bearish momentum will be demonstrated. Current support short term near the 90 cents level could prove important psychologically. The last time XRP/USD traded below the 0.90000 level with consistency was in the second week of August, this while XRP/USD was recovering from lows made on the 21st of July which touched nearly 0.51000.
Ripple Outlook for October
Speculative price range for XRP/USD is 0.63000 to 1.26000.
If Ripple continues to see negative technical data develop the 85 cents level could prove a dramatic ignition switch. While the 88 cents mark has been tested a few time recently in the last week of September, if the current support levels crumble and 85 cents is approached, this could cause further downside speculation and cause traders of XRP/USD to initiate selling positions.
This is because the last time Ripple traded near the 0.85000 mark was on the 10th of August and there appears to be a serious amount of room to traverse downward in a hurry if this support level is proven vulnerable. Traders should not get overly ambitious if they are sellers and use effective take profit targets to cash out winning wagers. However, if the 85 cents level fails to hold back bearish sentiment, there is reason to suspect the 73 cent mark could get a test too.
XRP/USD achieved a high water mark of nearly 1.40000 in early September, so speculative optimists who believe a reversal is about to develop cannot be blamed. However, the trend in XRP/USD has been rather strong and definitive the past handful of weeks with a bearish mode. Wagering on upside price action via XRP/USD should probably be done with rather conservative targets. If the 1.00000 level can be breeched higher and sustained, XRP/USD then needs to prove it can challenge simple resistance levels like the 1.10000 mark. If that were to take place, traders could not be blamed for believing 1.16000 is a potential. However, for bullish momentum to suddenly emerge in XRP/USD the broad cryptocurrency will also have to show solid movement higher.

