Bullish View
Buy the BTC/USD pair and set a take-profit at 60,000.
Add a stop-loss at 55,000.
Timeline: 1-2 days.
Bearish View
Set a sell-stop at 55,750 and a take-profit at 54,000.
Add a stop-loss at 57,000.
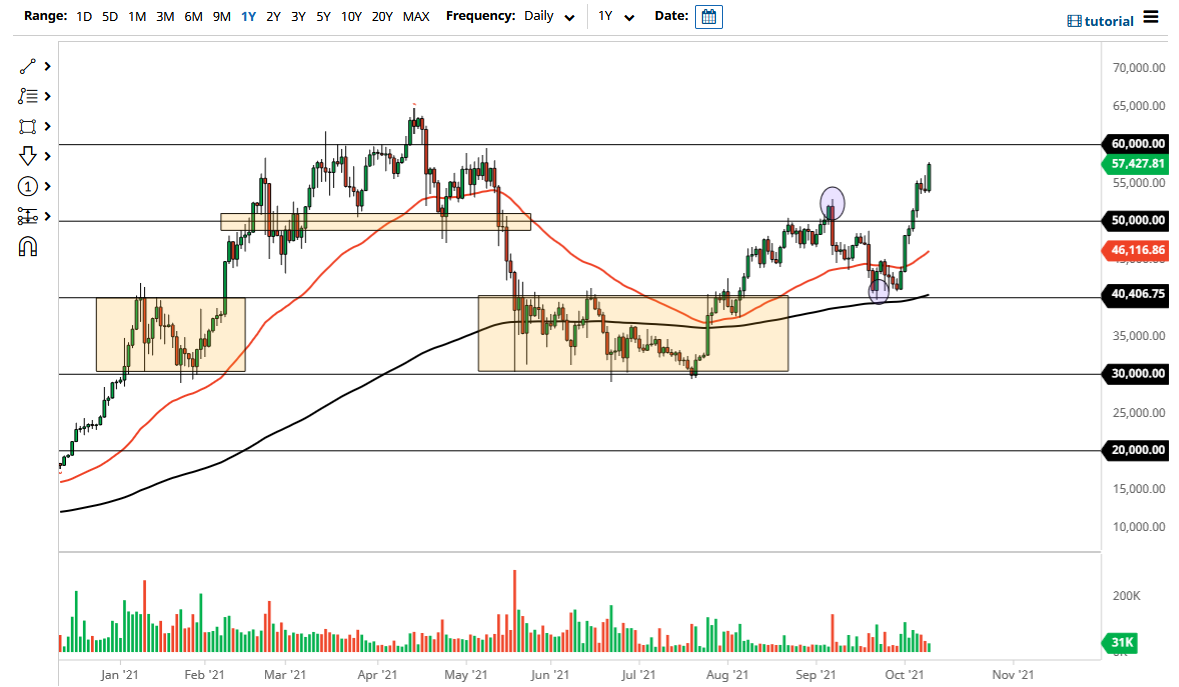
The BTC/USD price broke out as interest in cryptocurrencies rebounded. The pair jumped to a multi-month high of more than $57,000, bringing the gains since end of September to more than 45%. This makes it one of the best-performing assets this month and its total market capitalization to more than $1 trillion.
Why the Bitcoin Price Jumped
Analysts believe the current rally of BTC prices is mostly because of several factors. First, they cite the easing of concerns about China’s crackdown on cryptocurrencies. Last month, the People’s Bank of China (PBOC) said that all cryptocurrencies in the country were illegal.
It also ordered offshore companies like Binance and Huobi to stop offering crypto products to Chinese citizens. While these issues are major issues, there are signs that investors have moved past the issues. Besides, there are signs that the hash rate has remained relatively steady, meaning that mining activities are improving. Many Chinese miners have moved their operations to other countries like the United States and Canada.
The other potential catalyst for the BTC/USD rally is the rising optimism that the Securities and Exchange Commission (SEC) will provide a greenlight for new Bitcoin ETSs. The SEC has sounded optimistic about Bitcoin futures. Some analysts believe that such assets will lead to more adoption of Bitcoin by boosting inflows.
Another reason why the BTC/USD is rising is that some investors believe that it is a hedge against inflation. As such, with the cost of oil and other commodities soaring, some investors have moved to Bitcoin as a hedge. The pair will therefore react to actual numbers from the US about inflation that will come out on Wednesday. Analysts expect the data to show that inflation remained stubbornly above 2%.
BTC/USD Forecast
The four-hour chart shows that the BTC/USD pair has been in a major bullish trend in the past few days. The pair has formed a bullish flag pattern that is shown in green. It has also moved above the 25-period and 50-period exponential moving averages (EMA). The pair also moved above the key support level at 55,000.
Therefore, there are signs that the pair will keep rising in the coming days. If this happens, the next key resistance level to watch will be at 60,000. This view will be invalidated if the price moves below the key support at 55,000.

