Bearish View
Set a sell-stop at 57,000 and a take-profit at 55,000.
Add a stop-loss at 60,000.
Timeline: 1-3 days.
Bullish View
Set a buy-stop at 59,000 and a take-profit at 62,000.
Add a stop-loss at 57,000.
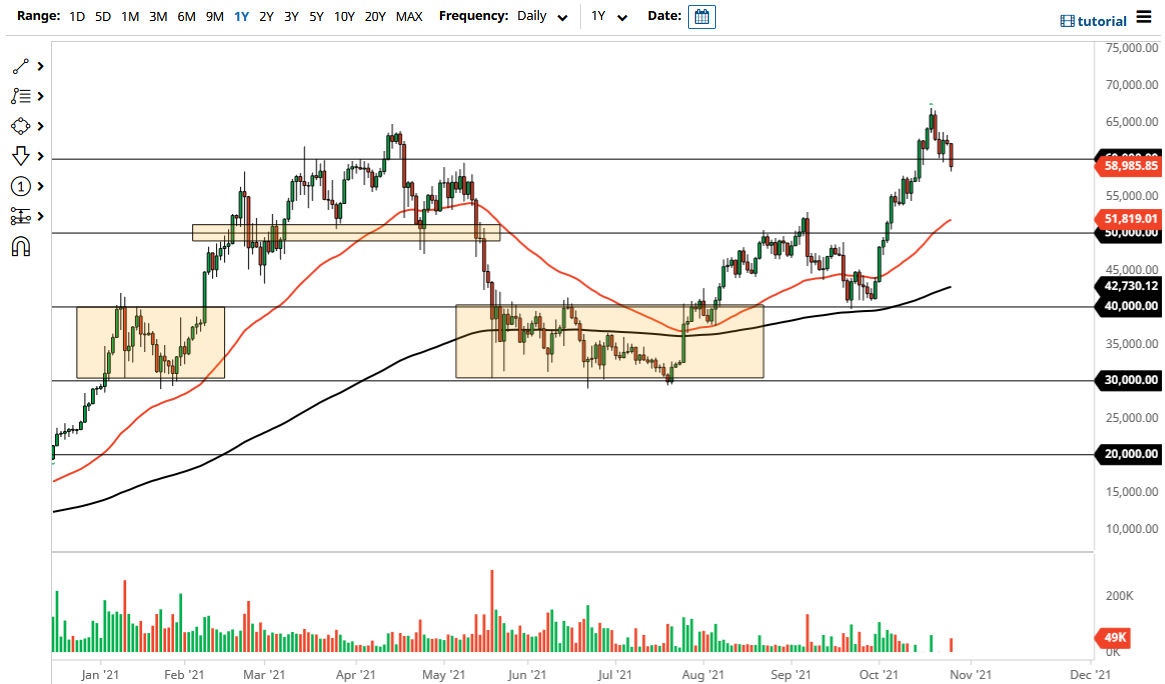
The BTC/USD pair retreated in the overnight session as the momentum about the Bitcoin ETF faded and the US dollar rebounded. The pair declined to 58,000, which was about 12% below the highest level this year.
BITO-Led Rally Fades
The BTC/USD rallied to an all-time high of more than $66,000 last week. At the time, the bullish momentum was driven by the launch of the first Bitcoin futures ETF whose ticker was BITO. The rally also happened as the US Dollar Index declined across the board. Bitcoin has an inverse relationship with the US dollar.
This week, the pair has declined in the past two straight days as this momentum faded and as investors started looking for another catalyst. In most cases, Bitcoin and other financial assets tend to retreat after a major event. For example, Bitcoin retreated briefly after last year’s halving event. It also declined shortly after Coinbase went public.
The next catalyst could be the approval of a Bitcoin ETF that holds Bitcoin. Already, GrayScale has already sought the SEC’s approval to convert its Bitcoin Trust into an ETF. The two products will be different since BITO currently tracks the futures listed at the CME. In a statement this week, Anthony Scaramucci, of Skybridge Capital, predicted that the SEC will approve an ETF by end of this year.
Still, on-chain data is supportive of Bitcoin. According to Glassnode, many large investors have continued to hold Bitcoin while the number of non-zero Bitcoin addresses has continued rising.
Later today, the BTC/USD will likely react mildly to the latest US GDP numbers that will come out in the afternoon session. These numbers are expected to show that the American economy held steady in the third quarter.
BTC/USD Forecast
The daily chart shows that the BTC/USD pair has been in a sell-off this week. However, a closer look at the pair shows that this decline is part of the bullish trend. For one, the coin is in the midst of forming a cup and handle pattern. In price action analysis, a cup and handle pattern is usually a sign of bullish continuation. The pair is also being supported by the 25-day and 50-day moving averages.
Therefore, there is a likelihood that the handle formation will see the pair decline further in the near term. However, in the longer term, the pair will maintain its bullish trend.

