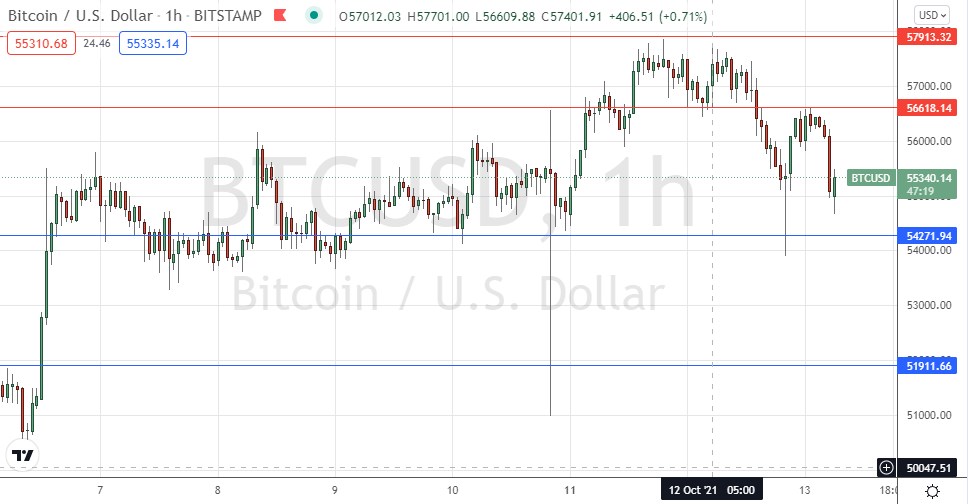
Last Monday’s BTC/USD signal may have produced a slightly profitable long trade from the bullish bounce off the identified support level at $56,168.
Today’s BTC/USD Signals
Risk 0.50% per trade.
Trades must be taken before 5pm Tokyo time Thursday.
Long Trade Ideas
Go long after a bullish price action reversal on the H1 time frame following the next touch of $54,272 or $51,912.
Place the stop loss $100 below the local swing low.
Move the stop loss to break even once the trade is $100 in profit by price.
Take off 50% of the position as profit when the trade is $100 in profit by price and leave the remainder of the position to run.
Short Trade Ideas
Go short after a bearish price action reversal on the H1 time frame following the next touch of $56,618, $57,913, or $59,691.
Place the stop loss $100 above the local swing high.
Move the stop loss to break even once the trade is $100 in profit by price.
Take off 50% of the position as profit when the trade is $100 in profit by price and leave the remainder of the position to run.
The best method to identify a classic “price action reversal” is for an hourly candle to close, such as a pin bar, a doji, an outside or even just an engulfing candle with a higher close. You can exploit these levels or zones by watching the price action that occurs at the given levels.
BTC/USD Analysis
I wrote last Monday that we had a basically bullish picture with several clear support levels below the current price. I thought that if the support level I had identified at $56,168 held up, we would probably see a further rise over the day to at least $57,913. The level did hold, and the price peaked just below that resistance level later.
The picture now is more bearish, with markets retreating from most trends ahead of US inflation data due later today. Here, the reversal looks stronger than in most other assets, as we see signs of the price topping out below $58k. The neckline seems to be at $54,272 which looks like a very crucial level now. If the price breaks down below that later, it will be a bearish sign which could trigger a sharp downwards price movement.
It will probably be wise not to be too bearish too quickly, as although the price action at the top looks bearish with a “shoulder” forming off the new lower resistance level at $56,618, there seems to be plenty of strong buying every time the price gets close to the support level at $54,272, so bulls are still in with a chance if they buy any bounces off this level which may happen today.
Some analysts are seeing Bitcoin as overbought, but the history of Bitcoin price movements in recent years suggests that Bitcoin rallies can go on for a long time in such “overbought” conditions.
Regarding the USD, there is nothing of high importance scehduled today.

