Bearish View
Place a sell trade on EUR/USD and set a take-profit at 1.1450.
Add a stop-loss at 1.1580.
Timeline: 1-2 days.
Bullish View
Place a buy stop at 1.1565 and a take-profit at 1.1650.
Add a stop-loss at 1.1500.
The EUR/USD price made a bearish breakout on Tuesday as investors focused on the upcoming inflation data from the United States. The pair dropped to 1.1532, which was the lowest level since October 6.
US Inflation Data Ahead
The EUR/USD pair declined after the latest US vacancies data. According to the Bureau of Labor Statistics (BLS), the country’s job vacancies declined from more than 11 million in July to more than 10.43 million in August. This increase was better than the median estimate of more than 10.95 million.
This data came a few days after the US published the relatively mixed employment numbers. The numbers showed that the country’s economy added just 194k jobs in September while the unemployment rate declined to 4.8%. Wages also remained steady.
With the unemployment numbers already out, the next key catalyst for the EUR/USD will be the latest US inflation numbers scheduled for later today.
These numbers are expected to show that inflation remained relatively high in September. Besides, the travel industry, which dragged prices in August, made a modest recovery in September. At the same time, with oil prices rising, there is a possibility that prices will remain high. Analysts expect that the headline CPI rose by 5.3% in September while core CPI jumped by 4.0%.
Meanwhile, the EUR/USD pair declined as bond yields retreated. The 10-year bond yield declined to 1.589% while the 30-year declined to 2.113%. Still, these numbers are significantly higher than where they were last week. This trend is a sign that investors expect the Federal Reserve to start tightening. Indeed, in a statement on Tuesday, Fed’s Raphael Bostic said that a lot of progress has been made to start winding the large-scale asset purchases.
EUR/USD Forecast
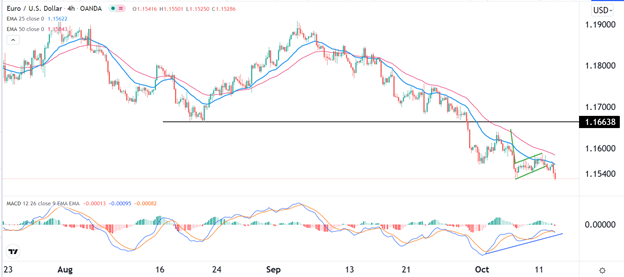
The EUR/USD pair made a bearish breakout on Tuesday after it spent a few days in a consolidation mode. Before the bearish breakout, the pair was forming a bearish flag pattern. In price action, this pattern is usually a bearish sign. It has also moved below the 25-day and 50-day moving averages while the MACD has formed a bearish divergence pattern.
Therefore, the pair will likely keep dropping, with the next key support level being at 1.1450. On the flip side, a move above the key resistance at 1.1585 will invalidate the bearish view.

