Bearish Sign
Sell the AUD/USD and set a take-profit at 0.7200.
Add a stop-loss at 0.7400.
Timeline: 1-2 days.
Bullish Sign
Set a buy-stop at 0.7340 and a take-profit at 0.7450.
Add a stop-loss at 0.7250.
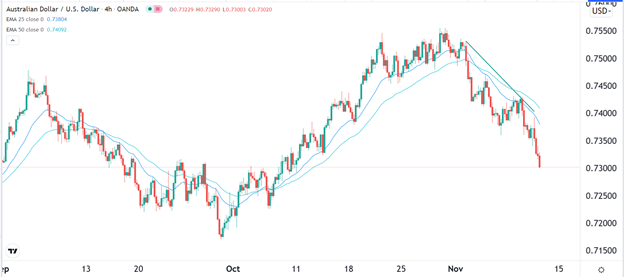
The AUD/USD pair declined for three consecutive days as investors reflect on the fast-rising American inflation and the relatively weak Australian jobs numbers. It is trading at 0.7312, which is about 3.2% below the highest level in October.
US Inflation and Australian Jobs Numbers
The AUD/USD pair declined sharply after the relatively strong American inflation data. The data showed that the country’s headline inflation rose to the highest level in more than 30 years. The headline Consumer Price Index rose to 6.2%, which was higher than the median estimate of 5.8%.
Core inflation rose to 4.6%, which was substantially higher than the previous jump of 4.2%. The two numbers also rose on a month-on-month basis. Therefore, these numbers signal that the Federal Reserve will likely accelerate the pace of asset purchases. It will also likely hike interest rates earlier than expected.
Australia is also seeing high inflation. For example, home prices in most cities and even rural areas have risen to record highs.
Meanwhile, the AUD/USD pair also declined because of the weak Australian jobs data. According to the Australian Bureau of Statistics (ABS), the country lost more than 46.3k jobs in October. This was in addition to the 138k jobs that the country lost in September. Analysts were expecting the data to show that the economy added 50k jobs.
The participation rate rose from 64.5% in September to 64.7% in October. At the same time, the county’s unemployment rate jumped from 4.6% to 5.2%. These numbers signal that the country’s economy is recovering at a relatively slower pace than expected. Still, there is a possibility that the situation will stabilize in the coming months.
AUD/USD Forecast
The four-hour chart shows that the AUD/USD pair has been in a major sell-off in the past few weeks. The pair has dropped to the lowest level since October 11. It has also moved below the 25-period and 50-period exponential moving averages (EMA). The pair has also formed the three-black crows pattern, which is usually a bearish signal.
Therefore, the pair will likely keep falling as bears target the key support at 0.7200. On the flip side, a move above 0.7350 will invalidate the bearish view.

