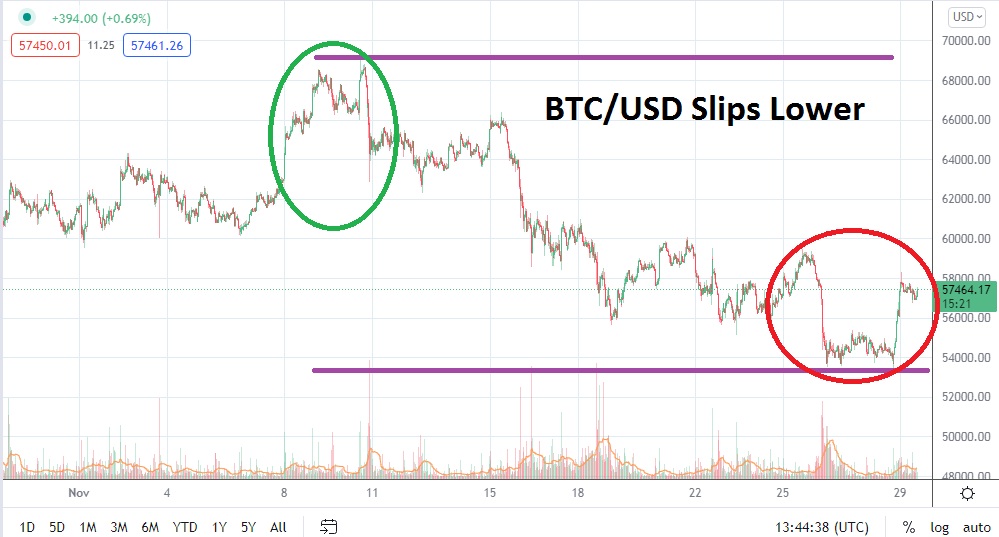
After reaching all-time highs on the 10th of November near the 69,100.00 price, BTC/USD has slipped lower. The low for November was seen on the 28th when Bitcoin traded near the 53,300.00 mark, before experiencing a reversal higher which has brought the price of the cryptocurrency to nearly 57,200.00 as of this writing.
It appears BTC/USD may potentially begin the month of December below the 60,000.00 juncture and could be lower than values seen on the 31st of October which hovered near the 59,900.00 ratio. Making short-sighted perceptions based on those numbers is likely a ‘Fools Game’, because BTC/USD certainly has the capability to move in a rapid manner and destroy all notions within a couple of hours of trading.
However technical traders who are looking at one-month and longer charts cannot miss the telltale indications of a slight and perhaps problematic bearish trend the past few weeks which has developed. After achieving all-time highs early in the second week of November, having been built upon a serious amount of bullish momentum, BTC/USD has struggled and found prevailing headwinds technically.
The support level of 53,000.00 appears rather important. This ratio was essentially the place where BTC/USD was able to build a consolidated base in the first week of October, before Bitcoin began to challenge and surpass spring’s high water levels. A high price of nearly 64,500.00 was exhibited in the second week of April. The run higher this October and early November was strong technically, but may have also been fueled by some institutional buying which decided to participate in Bitcoin ETF assets now being offered.
Also intriguing and a potential test of BTC/USD in the coming weeks may be the proclamations of Bitcoin proponents who view the cryptocurrency as a ‘new’ store of value in dangerous market conditions. As news develops regarding the new strain of coronavirus ‘Omicron’ it will be tantalizing to see how BTC/USD correlates technically with gold, this because if Bitcoin is an actual ‘safe haven’ asset of the future it stands to reason BTC/USD will feel some of the speculative ‘juice’ generated by any of the developing news.
BTC/USD Outlook for December
Speculative price range for BTC/USD is 42,000.00 to 74,000.00 – yes, a wide range.
If support levels near the 55,000.00 are tested and prove vulnerable traders may get nervous that the 53,000.00 mark could become a target. If for some reason the 53,000.00 ratio is tested and becomes weak, this could spark nervous selling within Bitcoin by speculators who may perceive this level as a signal BTC/USD could test values seen in late September. While the 49,000.00 value may look like a considerable distance away, any test of this level could set off another storm of nervous selling.
Bullish speculators may actually be enjoying the slight slip in value BTC/USD has experienced the past few weeks and look at the current price ratios as a buying opportunity. If the 55,600.00 to 54,500.00 support levels prove adequate, it could provide traders technically with the opinion that the current slump in BTC/USD is actually a consolidation mode as Bitcoin builds a base of support so it can reignite stronger buying. If the 59,000.00 ratio is penetrated and swift price velocity is seen, there is reason to suspect another test of 60,000.00 could happen quickly.
If the 60,000.00 juncture is seen in the near term, traders may view this as a very positive sign and believe BTC/USD will begin again to try and test all time record levels. If the 65,000.00 value is touched and sustained, this could be a signal the target of 69,000.00 to 70,000.00 prices are legitimate goals for speculators who want to wager on more upside.

