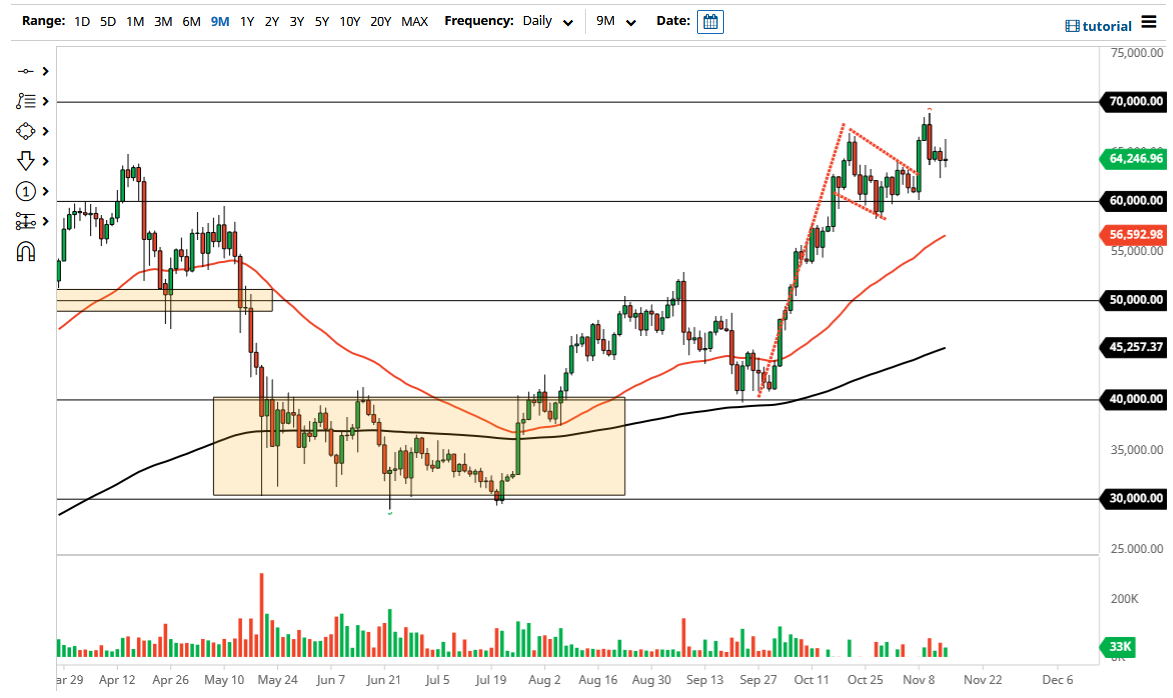
The Bitcoin market initially tried to rally on Monday to show signs of strength, but then gave back the gains to finish relatively unchanged. The candlestick is a bit of a shooting star, but it is also worth noting that the previous candlestick is a hammer. This suggests that the market is still trying to figure out where to go next, but we are in an uptrend and that is what we should be paying quite a bit of attention to. If we can break above the top of the candlestick during the trading session on Monday, it is likely we could go looking towards the highs again, perhaps even $70,000.
It is also worth noting that the market is hanging around just above the bullish flag that I have marked on the chart, which happens to measure for a move all the way to the $85,000 level. Because of this, I think it is only a matter of time before we get to that level, but it may take several weeks. After all, Bitcoin does tend to be very noisy to say the least, with the $60,000 level underneath being a massive support level. The 50-day EMA is likely to continue to reach towards the $60,000 level as well, so that is without a doubt worth noting going forward.
I think any pullback in Bitcoin makes for a nice buying opportunity in what has been an extraordinarily bullish marketplace. In fact, Bitcoin has seen a bit of inflow due to the ETF that has been authorized. With this, you will continue to see more inflow, so it is likely that there are buyers coming into this market every day. If we were to break down below the 50-day EMA, then I think the absolute “floor in the market” is somewhere closer to the $50,000 level. That is an area that has a large, round, psychologically significant attitude attached to it, and an area where we have seen a lot of resistance in the past. In other words, “market memory” should come into play somewhere around that level. If we can break above the $70,000 level, then that will kick off the next bigger move towards the $75,000 level, but of course with an eye on the $85,000 level eventually.

