Bullish View
Set a buy-stop at 61,500 and set a take-profit at 63,000.
Add a stop-loss at 60,000.
Timeline: 1-2 days.
Bearish View
Set a sell-stop at 59,500 and a take-profit at 57,000.
Add a stop-loss at 62,500.
The BTC/USD pair dropped below the key support of 60,000 on Tuesday. This happened as the US dollar strength accelerated and Bitcoin demand waned. Other altcoins like Ethereum, Ripple, and Cardano also crashed. This led to the total market capitalization of all cryptocurrencies tracked by CoinGecko to fall below $3 trillion.
Strong USD and the Taproot Sell-Off
The BTC/USD pair has retreated this week partly because of the recent Taproot upgrade. This was the biggest upgrade to Bitcoin since 2017. The upgrade brought more privacy features in the network. It also led to new smart contracts features, which could push developers to build apps using the network.
Bitcoin rallied to a new all-time high in anticipation of the upgrade. Historically, most cryptocurrencies tend to rally ahead of a key upgrade. Now, this sell-off is likely because of these investors who are exiting. It is a phenomenon known as buying the rumors and selling the news. Investors are also waiting for the next catalyst.
The pair also declined because of the strong US dollar. The dollar index has rallied to the highest level since 2020 as investors anticipate a more aggressive Federal Reserve. This is driven primarily by the overall strong economic data from the United States.
Here is a recap: early this month, the Fed met and decided to taper asset purchases in line with expectations. Two days later, the Bureau of Labor Statistics published strong jobs numbers that revealed that the unemployment rate dropped to 4.6%.
A few days later, the US published strong inflation numbers. And this week, the US released strong retail sales, export and import prices, and industrial and manufacturing production data. Therefore, while Bitcoin is often seen as an inflation hedge, it also tends to lag in a tightening environment.
BTC/USD Forecast
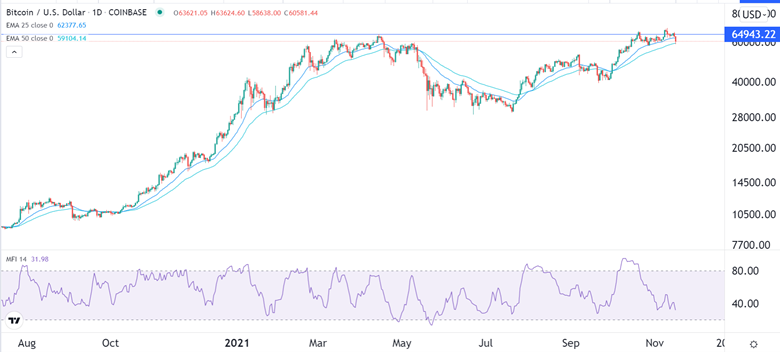
The daily chart shows that the BTC/USD pair has found a strong resistance. This is notable since this resistance is slightly above the previous all-time high. It has also formed a cup and handle pattern, which is usually a bullish sign. The pair is also being supported by the 25-day moving average.
Therefore, there is a likelihood that the pair will consolidate in this range in the next few days and then have a bullish breakout. If this happens, the pair will likely retest the key resistance at 65,000. On the flip side, a drop below 60,000 will signal that there are still more sellers in the market.

