Bearish View
Set a sell-stop at 55,000 and a take-profit at 53,000.
Add a stop-loss at 58,000.
Timeline: 1-3 days.
Bullish View
Set a buy-stop at 57,000 and a take-profit at 60,000.
Add a stop-loss at 55,000.
The BTC/USD price remained under pressure as investors reflected on news about India. The pair also struggled after more signs emerged that the Federal Reserve will tighten faster than expected. It is trading at 56,640, which is about 18.2% below the highest point this month.
India Crypto Ban
The Indian government has not been friendly to cryptocurrencies. Early this year, news spread that the government was about to ban all cryptocurrencies. Since then, the government has been writing a bill that will effectively ban most cryptocurrencies.
In a statement on Tuesday, an official of Narendra Modi’s government confirmed that the government was crafting a bill to regulate the currencies. Another bill in the parliament’s website said that the plan would prohibit all private cryptocurrencies in India. In the past few months, the country’s central bank has said that it was building its own cryptocurrency.
The bill also noted that it will allow certain exceptions to promote the underlying technology of cryptocurrencies and its uses. This bill will be introduced to parliament on Monday.
Still, the impact of India’s withdrawal will likely be limited. Besides, many Indians have stayed out of the market because of regulatory fears.
The BTC/USD pair also declined because if the relatively stronger US dollar after the Fed minutes showed that more members were open to further tightening. In the meeting, the bank decided to leave rates unchanged and reduced the size of quantitative easing.
The case for more tightening came after the US published strong initial and continuing jobless claims, inflation, durable goods, housing and GDP numbers.
Fundamentally, there is a likelihood that the Bitcoin price will bounce back in the coming weeks. Historically, the coin tends to rise after Thanksgiving.
BTC/USD Forecast
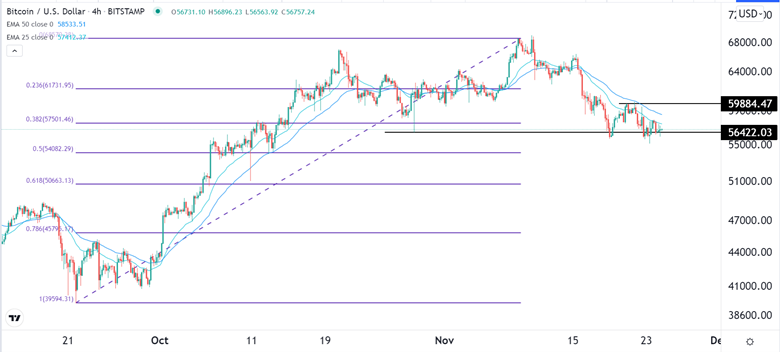
The four-hour chart shows that the BTC/USD is at an important support level. The pair is trading at 56,640, where it struggled to move below since November 19th. The pair’s decline is still below the 25-day and 50-day moving averages. The price is also below the 38.2% Fibonacci retracement level.
Therefore, a break below the support at this week’s low of 55,350 will invalidate the small double-top pattern and signal that there are still more sellers. This will likely lead to more weakness as bears target the key support at 50,000. This view will be invalidate if it moves above 59,000.

