Bullish View
Set a buy-stop at 61,500 and a take-profit at 64,000.
Add a stop-loss at 59,000.
Timeline: 1-2 days.
Bearish View
Set a sell-stop at 59,500 and a take-profit at 58,000.
Add a stop-loss at 62,000.
The BTC/USD price moved sideways as October’s spectacular rally took a breather. The pair is trading at 60,945, which is about 9% below the highest level in October.
Bitcoin Rally Pauses
Bitcoin has struggled to find direction in the past few days as investors look for the next key catalyst. In October, the coin jumped sharply as investors reflected on the launch of the Bitcoin Futures ETF (BITO). Analysts expect that the SEC will accept more BTC ETFs later this month.
At the same time, there is an expectation that the Gary Gensler-led commission will accept an ETF that tracks real Bitcoin instead of futures.
Meanwhile, the BTC/USD is also reacting to the ongoing trend of more demand for cryptocurrencies by institutional investors. For example, in a statement on Monday, Digital Currencies Group (DGC) said that its valuation had soared to more than $10 billion.
This is after the company raised about $25 million from a group of investors led by Softbank and Alphabet. DGC owns Grayscale, the company that runs several cryptocurrency funds. It also owns Coindesk, a popular publisher of cryptocurrency content.
Other blockchain companies have raised millions of dollars lately. For example, FTX, a crypto exchange raised millions of dollars in October, pushing its total market capitalization to more than $25 billion.
Meanwhile, on-chain data shows that activity in the blockchain industry did relatively well in October. For example, the number of accounts with Bitcoin has surged while the hash rate has also risen.
Indeed, according to BTC.com, Bitcoin mining difficulty increased for the eighth time after China started a crackdown of the practice. The difficulty moved to above 21.66 trillion, the highest level since August. Its hash rate has jumped 155 EH/S.
Bitcoin Price Prediction
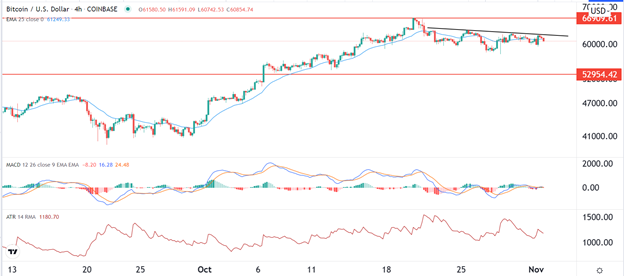
The four-hour chart shows that the BTC/USD pair has been in a tight range recently. Along the way, it has formed a descending trendline that is shown in black. It has also moved to the 25-day moving average while the Average True Range (ATR) has dropped. The ATR is a popular indicator that measures volatility. The MACD as well has also moved to the neutral level.
Therefore, the outlook for the pair is neutral with a bullish bias. A bullish breakout will be confirmed if the price manages to move above the descending trendline. If this happens, the next key resistance level will be at 64,000.

