Bearish View
Set a sell-stop at 58,470 and a take-profit at 55,000.
Add a stop-loss at 60,000.
Timeline: 3 days.
Bullish View
Set a buy-stop at 60,000 and a take-profit at 63,000.
Add a stop-loss at 58,000.
The BTC/USD pair struggled to bounce back as it crashed to a multi-week low. The pair dropped to a low of 58,470, which was about 15% below the all-time high. Other altcoins like Ethereum, Ripple, and Dogecoin also struggled as cryptocurrencies shed more than $300 billion of value.
High Interest Rate Worries
The BTC/USD soared to an all-time high last week even as the US published strong inflation numbers. The data revealed that the American economy’s inflation jumped to a 30-year high in October as oil and gas prices jumped.
The rally happened for two main reasons. First, some investors believe that Bitcoin is a store of value and a hedge against inflation. Indeed, the debate of the better option between gold and Bitcoin has been ongoing for years.
Second, the BTC/USD pair rallied because of the anticipation of the taproot upgrade. This was a major upgrade that introduced new features to Bitcoin’s ecosystem. It was the first time in years that the group agreed to do an upgrade.
Therefore, this week’s sell-off is mostly because of the realization that higher inflation will likely trigger the Federal Reserve to be more aggressive. This is evidenced by the fact that the US dollar has bounced back in the past few days. US bond yields have also risen substantially.
The other reason for the sell-off is what is known as buying the rumour and selling the news. Historically, Bitcoin tends to retreat sharply after a major announcement. In this case, the announcement was the Taproot upgrade. Another announcement was the latest infrastructure bill that introduced some regulations to the industry.
Still, the cryptocurrency industry is vibrant, as evidenced by the recent announcements. For example, ConsenSys raised $200 million at a $3.2 billion valuation while Crypto.com spent more than $900 million for the naming rights of Staples Center.
BTC/USD Forecast
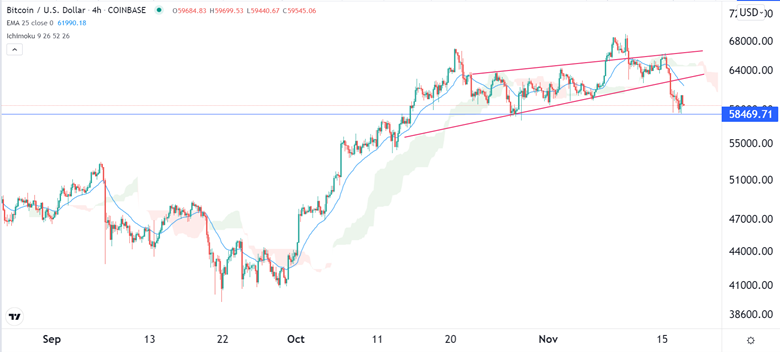
The four-hour chart shows that the BTC/USD pair has been in a steep bearish trend in the past few days. And this week, the pair tested the key support level at 58,469, which was the lowest level on October 28.
The pair then attempted to stabilize at these levels. Also, it moved below the 25-day and 50-day moving averages. It is also along the lower side of the rising wedge pattern.
Therefore, for now, the pair will remain under pressure as the profit-taking phase continues. This could see it drop to the support at 55,000.

