Bullish View
Buy the BTC/USD and set a take-profit at 66,000.
Add a stop-loss at 62,000.
Timeline: 1-3 days.
Bearish View
Set a sell-stop at 63,000 and a take-profit at 60,000.
Add a stop-loss at 65,000.
The BTC/USD is still hovering near its all-time high as investors reacted to the weekend’s taproot upgrade. The pair is trading at 64,000, which is about 7% below its highest level this month. At the same time, the Bitcoin Fear and Greed Index has dropped from last week’s high of 76 to the current 72.
Taproot Upgrade
The BTC/USD pair's relentless rally that was experienced earlier this month has faded. This is partly because the main catalyst for the rally has already happened. And in most times, financial assets tend to retreat when an anticipated event happens.
The Bitcoin price rallied substantially in the past few weeks as investors waited for the Taproot upgrade. This was Bitcoin’s first upgrade in four years. The upgrade will see Bitcoin increase the privacy of its network.
And most importantly, it will open the door for the network bringing smart contracts. This is an important step since in the future, developers will be able to build applications such as those in DeFi and NFTs.
Unlike the previous upgrade, Taproot had the support of most miners and participants. Therefore, the price has moved sideways as investors look for the next catalyst.
While it is too early to tell, there is a likelihood that the price will resume the bullish trend as talk of a santa rally resumes. A Santa rally is a situation where prices of key assets start rising towards Christmas.
Data compiled by BTC.com shows that Bitcoin’s hash rate has risen to the highest level since October 20th. The mining difficulty has also jumped to the highest level since October as well. These are signs that activities within the network have been relatively strong recently.
The BTC/USD will likely react to the latest American retail sales data that will come out later today.
BTC/USD Forecast
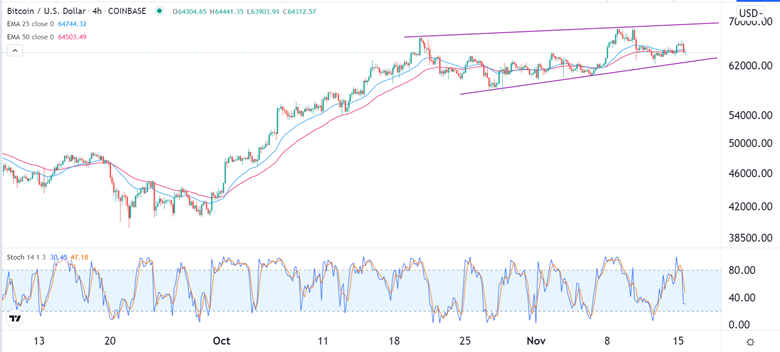
The four-hour chart shows that the BTC/USD pair has been in a relatively tight range in the past few days. The pair has oscillated between the support at 64,000 and the resistance of about 66,000. As a result, the pair is trading at the same level as the short and longer-term moving averages. It has also formed a rising wedge pattern, which is usually a bearish sign.
Therefore, for now, the pair will likely remain in the current range as investors wait for a catalyst. While the overall outlook is bullish, a minor correction cannot be ruled out in the near term.

