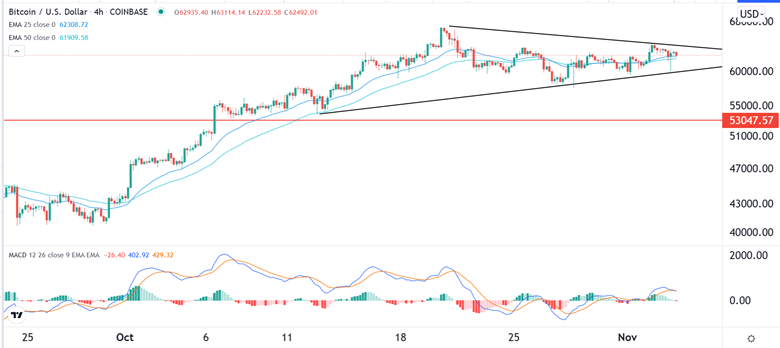
Bullish View
Set a buy-stop at 63,500 and a take-profit at 66,000.
Add a stop-loss at 60,000.
Timeline: 3 days.
Bearish View
Set a sell-stop at 60,000 and a take-profit at 58,000.
Add a stop-loss at 63,500.
The BTC/USD was in a tight range on Thursday morning as the market reflected on the latest Federal Reserve decision and its impacts on risky assets. The pair is trading at 62,480, where it has been in the past few days.
Fed Decision and Bitcoin
The BTC/USD has moved sideways this week as investors waited for the actions by the Fed. Besides, the bank’s easy money policies have made it relatively cheap for investors to invest in risky assets like cryptocurrencies and growth stocks.
In its decision on Wednesday, the bank announced that interest rates will remain at the current range of between 0% and 0.25% for a while. At the same time, the bank will continue buying its asset purchases in a bid to continue supporting the economy.
The BTC/USD pair’s performance was in line with other assets like stocks. None of them reacted in a negative way to the tapering because the Fed decision action was already priced in by the market.
Meanwhile, Bitcoin is in a tight range because the impacts of the recent Bitcoin ETF have started fading. As such, investors are actively trying to find other catalysts that will push the price relatively higher.
The catalyst could be the upcoming US jobs data that will come out on Friday. These numbers are expected to show that the country’s labour market rebounded in October while the unemployment rate declined. Therefore, stronger-than-expected jobs numbers will likely put more pressure on the Fed to move more aggressively in the coming months.
At the same time, on-chain data shows that Bitcoin activities are rising. For example, the hash rate has continued rising while mining difficulty has soared.
BTC/USD Forecast
Turning on the four-hour chart, we see that the BTC/USD pair has been in a consolidation mode in the past few days. A closer look also shows that the pair has formed a triangle pattern. This triangle is closer to reaching its confluence zone, meaning that Bitcoin could soon have a breakout. Because of its narrow range, the pair is also trading along the 25-day and 50-day moving averages while the MACD is above the neutral level.
Therefore, the pair will likely remain in this range in the near term. A breakout in either direction will then happen.

