Last Monday’s BTC/USD signal was not triggered, as none of the key levels which I had identified were reached that day.
Today’s BTC/USD Signals
Risk 0.50% per trade.
Trades may only be entered prior to 5pm Tokyo time Tuesday.
Long Trade Ideas
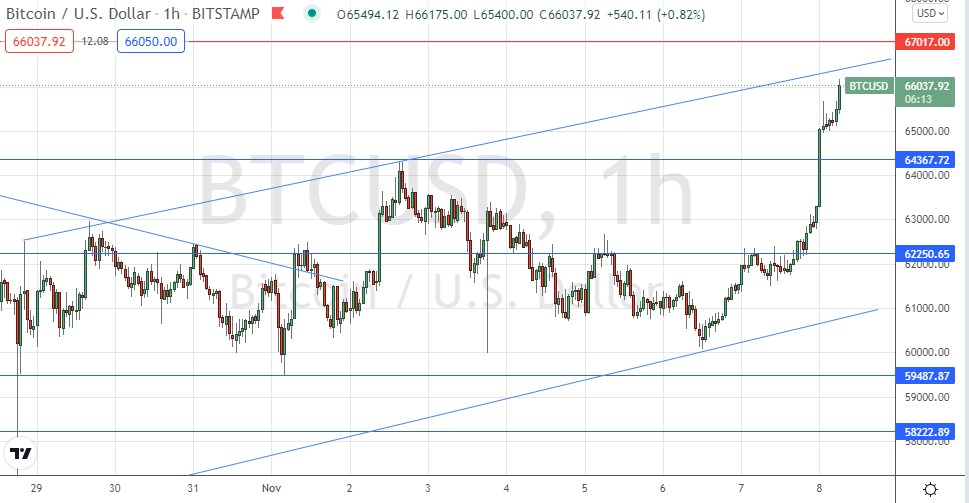
Long entry after a bullish price action reversal on the H1 time frame following the next touch of $64,368 or $62,250.
Place the stop loss $100 below the local swing low.
Move the stop loss to break even once the trade is $100 in profit by price.
Take off 50% of the position as profit when the trade is $100 in profit by price and leave the remainder of the position to run.
Short Trade Idea
Short entry after a bearish price action reversal on the H1 time frame following the next touch of $67,017.
Place the stop loss $100 above the local swing high.
Move the stop loss to break even once the trade is $100 in profit by price.
Take off 50% of the position as profit when the trade is $100 in profit by price and leave the remainder of the position to run.
The best method to identify a classic “price action reversal” is for an hourly candle to close, such as a pin bar, a doji, an outside or even just an engulfing candle with a higher close. You can exploit these levels or zones by watching the price action that occurs at the given levels.
BTC/USD Analysis
I wrote last Monday that the wide symmetrical bearish, descending price channel was a strong force depressing the price of Bitcoin right now. However, I was looking for a buy at support below $60k, and although the price never got back to this area, I was correct to anticipate that the bearish situation was quite likely to turn around. I was looking to turn bullish once Bitcoin decisively cleared the resistance levels at $63,763 and $64,368. This breakout beyond those levels has only just happened in the last few hours, with Bitcoin roaring ahead by 10% in value within the last 24 hours alone.
We now have a strongly bullish technical picture, with the ascending price contained within a new symmetrical price channel, but this time the channel is bullish. The price is currently not far below its all-time high made last month at $67,017 and if the price goes on to break above it, it will be trading in blue sky and could advance much further very quickly. However, there is also the risk that the price will quickly fall back, as it did last month.
There is a strong long-term bullish trend in Bitcoin with very strong short-term momentum, and for these reasons alone, Bitcoin looks like a very attractive buy if it retraces to any key support and makes a bullish bounce. The support at $64,368 looks key to watch, and we see some evidence that even the big round number at $65k could act as effective support above that.
I would not take any short trade today, but I note that the upper trend line is somewhat confluent with the all-time high at $67,017, so we may see some selling in that area.

There is nothing of high importance scheduled for today regarding the USD.
