Bearish View
Sell the EUR/USD and set a take-profit at 1.1300.
Add a stop-loss at 1.1500.
Timeline: 1-2 days.
Bullish View
Set a buy-stop at 1.1532 and a take-profit at 1.1600.
Add a stop-loss at 1.1450.
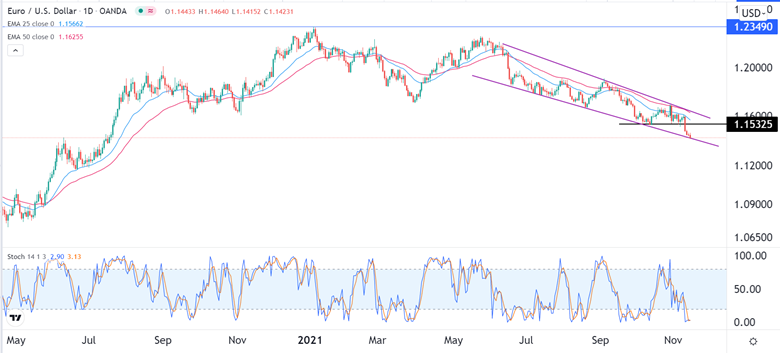
The EUR/USD pair crashed to the lowest level since July 2020 ahead of the latest EU GDP data and US retail sales numbers. It is trading at 1.1415, which is about 7.60% below the highest level this year. The pair has dropped by more than 2% this month.
EU GDP and US Retail Sales
The EUR/USD pair declined sharply in the overnight session as investors continued to worry about the rising global inflation. Recent data from key countries like Germany, China, and the US has shown that the world is going through a period of high inflation.
Indeed, American and German data revealed that inflation has jumped to the highest level in more than three decades. As such, investors are relatively concerned about stagflation, which is a period of high inflation and low GDP growth.
Meanwhile, recent data also showed that American economy recorded relatively slower growth in the third quarter. The economy rose by just 2% in the quarter after it rose by more than 5.7% in the previous quarter.
Therefore, analysts will be watching the latest Eurozone GDP data scheduled for later today. The numbers are expected to show that the Eurozone economy expanded by 3.7% in the third quarter. On a year-on-year basis, the economy is expected to expand by about 2.2%.
The next key data that will move the EUR/USD pair will be the latest US retail sales and export and import price indices.
The retail sales numbers will provide more signals about the impact of high inflation on consumer spending. Analysts expect the data to show that the headline retail sales rose from 0.7% to 1.2% while core sales rose to 1.0%.
Import price is expected to have risen from 0.4% to 1.0% while the export price index is expected to have fallen to about 0.9%.
EUR/USD Forecast
The EUR/USD pair made a major bearish breakout last week. At the time, the pair managed to move below the key support level at 1.1532, which was the previous year-to-date low. The pair accelerated the sell-off on Monday.
As a result, the stock has managed to move below the 25-day moving average. It is also along the lower side of the descending channel shown in purple. The Stochastic oscillator has also moved below the oversold level.
Therefore, the path of the least resistance for the pair is to the downside. The next key support to watch will be at 1.1300.

