The difference between success and failure in Forex trading is very likely to depend mostly upon which currency pairs you choose to trade each week and in which direction, and not on the exact trading methods you might use to determine trade entries and exits.
When starting the trading week, it is a good idea to look at the big picture of what is developing in the market as a whole and how such developments and affected by macro fundamentals and market sentiment.
There are a few strong valid long-term trends in the market right now, so it is a good time to be trading to take advantage of that.
Big Picture 7th November 2021
Last week’s Forex market moved in line with the long-term bullish USD trend and offered a few good short-term trading opportunities. There was plenty of activity in stocks and commodities. The S&P 500 stock market index rose over the week to close at an all-time high on Friday just below 4700. The Japanese yen was the strongest major currency over the past week while the Australian dollar was the weakest.
I wrote in my previous piece last week that the best trades were likely to be long of the S&P 500 Index in US dollar terms, and long USD/TRY and/or WTI Crude Oil when a new long-term high daily closing price was made, and short EUR/USD on Monday and then continuing if Monday’s daily (New York) close was below 1.1530. This was a good and profitable call as the S&P 500 Index rose by 1.89% over the week, and the USD/TRY rose by 0.80% after its close at a new high last Tuesday. This produced an average profit of 1.35%.
Fundamental Analysis & Market Sentiment
The headline takeaways from last week were:
The US Federal Reserve finally announced it would begin tapering its bond purchasing QE program this month, by $15 billion per month as had been expected. There are rising concerns about inflation which seems to be proving less transitory than the FOMC had expected, and that the Fed may be forced into an earlier than expected rate hike.
US Non-Farm Payrolls data came in higher than had been expected at 531k new jobs ahead of the anticipated 455k.
The Bank of England held off from a rate hike or ending its QE program although more committee members are now voting in favour of these measures. This sent the British pound sharply lower over the remainder of the week’s trading.
The Reserve Bank of Australia made a slight tightening of its monetary policy by dumping yield curve control.
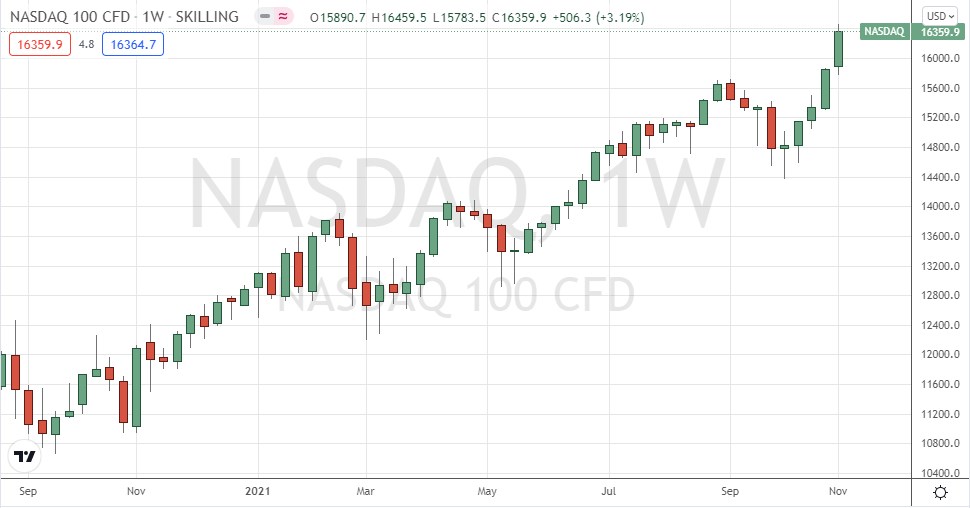
While commodities were mixed, stock markets were mostly higher. The U.S. S&P 500 and NASDAQ 100 indices ended the week closing at all-time high prices.
The Forex market has seen a rise by the US dollar in line with the long-term bullish dollar trend.
The coming week is likely to see a less active market, with few high impact events scheduled beyond a release of US CPI (inflation) data.
Last week saw the global number of confirmed new coronavirus cases rise for the third consecutive week after having fallen for two months. Approximately 50.2% of the global population has now received at least one vaccination. Pharmaceutical industry analysts now expect a large majority of the world’s population will receive a vaccine by mid-2022.
The strongest growths in new confirmed coronavirus cases right now are happening in Austria, Chile, Croatia, Czech Republic, Denmark, Egypt, Estonia, Finland, Georgia, Germany, Greece, Hungary, Iceland, South Korea, Laos, Montenegro, Netherlands, New Zealand, Norway, Slovakia, Slovenia, Switzerland, Poland, Russia, Slovakia, Slovenia, Switzerland, the Ukraine, and Vietnam.
Technical Analysis
U.S. Dollar Index
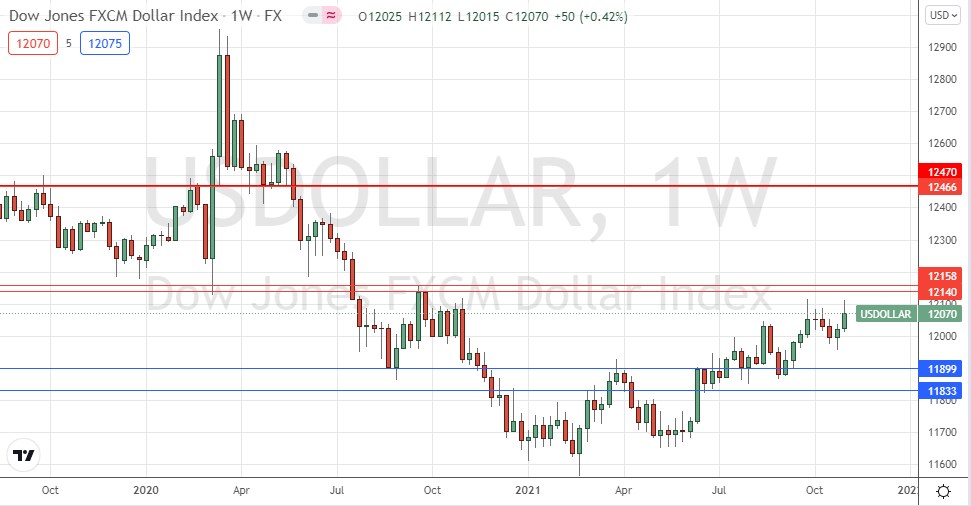
The weekly price chart below shows the U.S. Dollar Index printed a bullish candlestick last week, making its highest weekly closing price in over one year. The price is showing weak short-term bullish momentum, and the price is of course above its levels from 3 and 6 months ago, which shows that the long-term bullish trend in the greenback is still valid. The best strategy in the Forex market over the coming week will probably be to look for long trades in stocks or commodities, or in long USD Forex trades.
GBP/USD
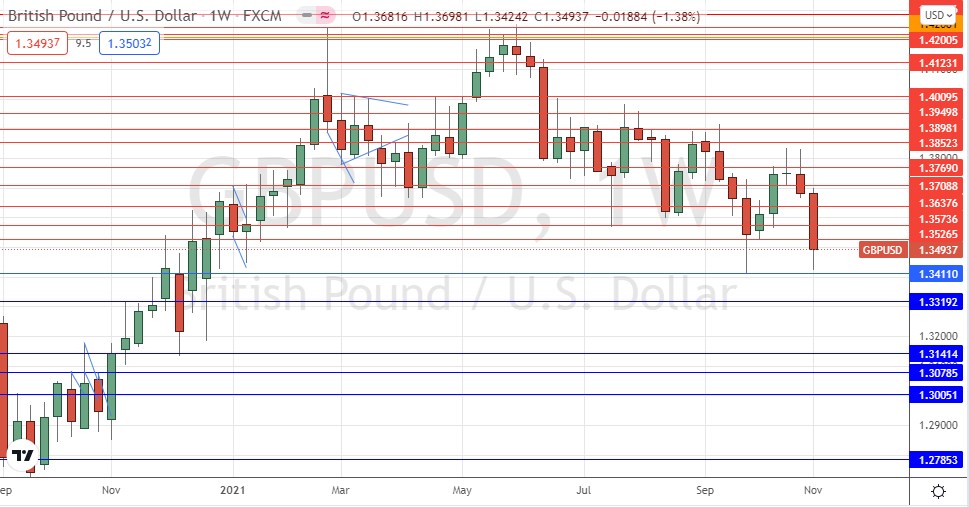
This major currency pair has been in a long-term bearish trend since May, but with deep bullish retracements, making it difficult to trade. However, following the Bank of England’s slow reaction to changing monetary conditions last week, we saw a sharp drop ending in the lowest weekly close here made in the last 10 months. Despite this, it should be noted that the price has not yet exceeded last week’s low, made at the support level of $1.3411.
If we get a daily (New York) close below $1.3411 – or ideally, below $1.3400 – we will probably see yet more downwards price movement, so there is likely to be a short trade opportunity here if this scenario plays out.
Traders do need to be careful to only trade short when the short-term momentum is bearish.
USD/TRY
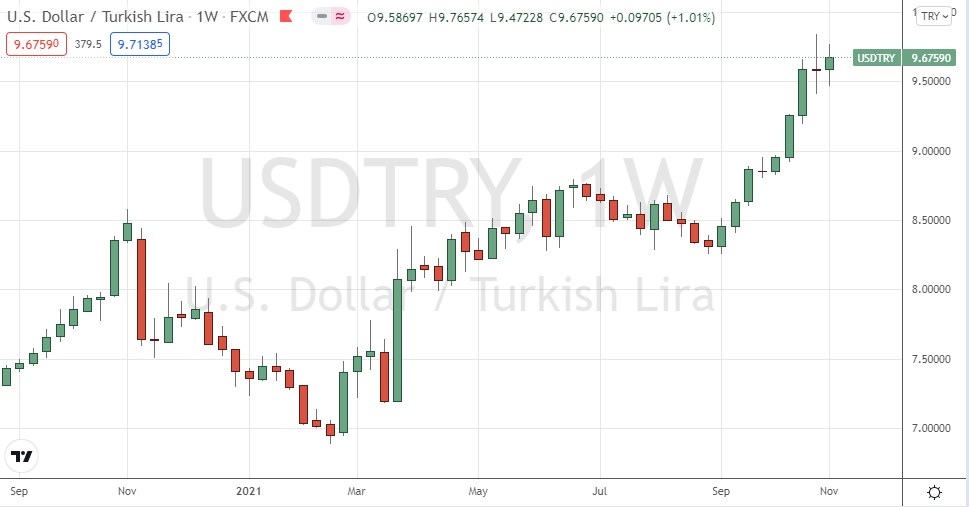
The price made an all-time high weekly closing price with a bullish inside bar, but did not exceed the high made during the previous week. This suggests bullish momentum but with a certain weakness. The story here is about the never-ending depreciation of the Turkish lira which is due partially to the fact that the Turkish central bank is subject to political interference from the presidency which has a very controversial view of monetary policy, and partially due to ongoing structural problems in the Turkish economy.
This could be a tempting long trade if we get a daily (New York) close here above 9.7239.
It can be difficult to trade the Turkish lira as spreads are wide and overnight financing fees (swaps) very high. However, the persistence of the short Turkish lira trend over many years can make it an attractive trade.
S&P 500 Index
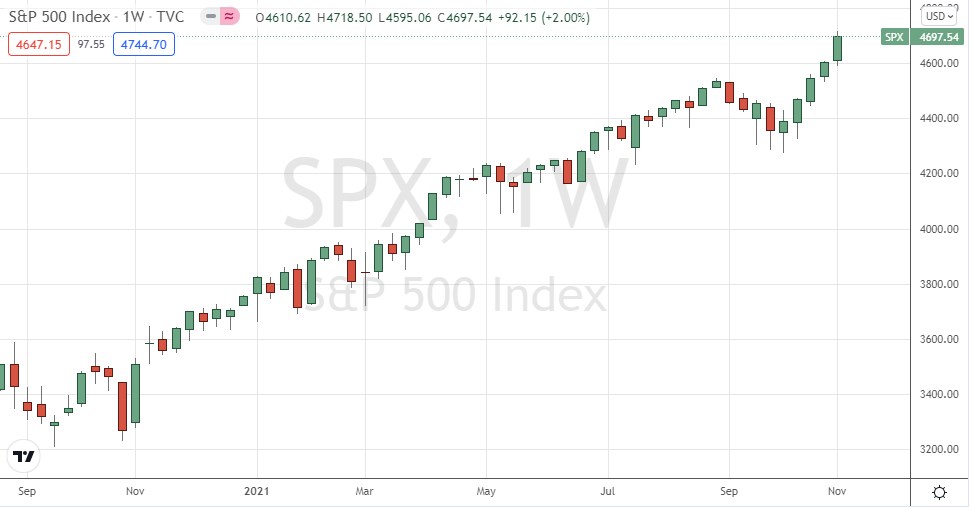
After trading below its 100-day moving average just a few weeks ago, the major US stock index has been roaring ahead for the past five weeks, rising in value during this time by about 8%. The end of last week saw the price reach another new all-time high, after having traded above the round number at 4700 for the first time.
The weekly candlestick was solidly bullish and closed not far from the top of its price range. This, and the record high, are bullish signs.
The S&P 500 Index looks likely to remain a good potential buy.
NASDAQ 100 Index
After trading below its 100-day moving average just a few weeks ago, the major US technology stock index has been roaring ahead for the past five weeks, rising in value during this time by about 11%. Last week saw the price close at another new all-time high.
The weekly candlestick was solidly bullish and closed near the top of its price range. This, the above-average weekly price range, and the record high, are all bullish signs.
The NASDAQ 100 Index looks likely to be a good buy.
Bottom Line
I see the best opportunities in the financial markets this week as likely to be long of the S&P 500 & NASDAQ 500 Indices in US dollar terms, and long USD/TRY and short GBP/USD following respective daily (New York) closes beyond the long-term high or low closing prices.


