Bullish View
Buy the GBP/USD pair and add a take-profit at 1.3630.
Add a stop-loss at 1.3500.
Timeline: 1-2 days.
Bearish View
Set a sell-stop at 1.3530 and a take-profit at 1.3450.
Add a stop-loss at 1.3650.
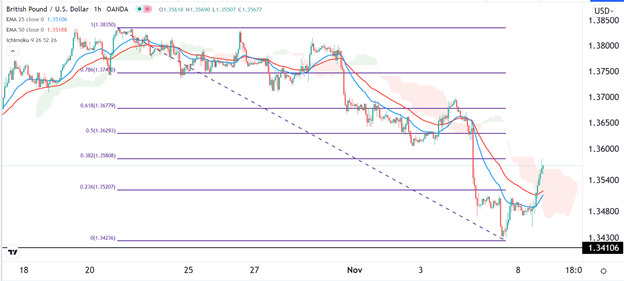
The GBP/USD pair jumped to the highest level since Thursday last week as concerns about inflation in the UK rose. The pair is trading at 1.3555, which is about 1% above the lowest level this month.
UK Inflation Concerns
There are concerns that UK’s inflation will keep rising as energy costs rise. The immediate cause of concern is that gas prices have been rising sharply because of Russia. While the country’s president has promised to increase production, there have been no signs that the country will do so.
Close watchers have not seen an increase in natural gas exports from Russia. At the same time, Gazprom, the country’s biggest gas company has not shown signs it will increase exports. Besides, it has not paid for extra pipeline capacity for the month.
Therefore, since energy is the biggest part of the UK inflation, there are signs that it will keep rising to a 30-year high.
The GBP/USD has bounced back as investors attempt to buy the dip following the big crash that happened last week after the Bank of England (BOE) decision. The bank surprised the market when it voted to leave interest rates and quantitative easing policies unchanged.
This was a surprise since most analysts were expecting the bank to at least start winding down its big quantitative easing (QE) policies. Other analysts were expecting that the Bank of England will hike interest rates. What was surprising was the fact that the number of policymakers who voted to maintain status quo was bigger than expected.
The next key catalyst for the GBP/USD will be a speech by Jerome Powell. In this speech, he will likely talk about what the bank will do in the coming months. Still, his language will likely be the same as during last week’s decision.
GBP/USD Forecast
The hourly chart shows that the GBP/USD pair held steady on Monday and early Tuesday. The pair rose to 1.3555, which is still lower than last week’s high of 1.3800. On the chart, the pair has formed a small head and shoulders pattern and moved slightly above the short and longer term moving averages. An inverted H&S pattern is usually a bullish sign. The pair also moved above the Ichimoku cloud.
Therefore, the pair will likely keep rising as bulls target the 50% Fibonacci retracement level at 1.3630.

