Bearish View
Sell the GBP/USD pair and set a take-profit at 1.3350.
Add a stop-loss at 1.3520.
Timeline: 1-2 days.
Bullish View
Set a buy-stop at 1.3500 and a take-profit at 1.3600.
Add a stop-loss at 1.3400.
The GBP/USD pair has been in a tight range in the past few weeks as investors reflect on the potential convergence between the Fed and the Bank of England (BOE). The pair is trading at 1.3445, where it has been in the past few days.
BOE and Fed Convergence
The UK and the US economies are doing relatively well, meaning that the Fed and the Bank of England (BOE) could be incentivized to tighten. This explains why the British pound has been relatively steady compared to other currencies like the euro, Australian dollar, Japanese yen, and Swiss franc.
For example, the UK published relatively strong economic numbers last week. On Tuesday, the Office of National Statistics (ONS) published relatively strong employment data. These numbers showed that the country’s unemployment rate declined to a pandemic-era low of 4.4%.
The following day, the ONS published strong inflation numbers. These numbers revealed that the country’s headline consumer price index (CPI) rose to 4.2%. This was the highest level it has been in more than a decade. It was also better than the median estimates.
On Friday, the agency showed that the country’s retail sales did well in October as buyers started buying early for the Christmas season. Therefore, there is a possibility that the Bank of England will adopt a relatively hawkish policy when it meets in the coming month.
The same can be said about the United States, where numbers have been relatively strong. Inflation has jumped sharply in the past few months and is currently at the highest level in more than 30 years. At the same time, the unemployment rate has dropped while retail sales and home prices have done well. Therefore, the GBP/USD has moved sideways as investors assess the stand of the Fed and Bank of England.
GBP/USD Forecast
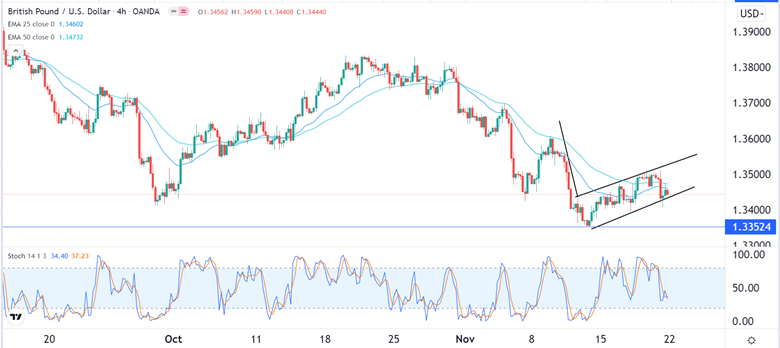
The four-hour chart shows that the GBP/USD has been in a relatively bullish trend recently even as other currency pairs like the EUR/USD and AUD/USD slip. The pair is trading at 1.3445, which is at the same level as the 25-day and 50-day moving averages. It has also formed what looks like a bearish flag pattern that is shown in black.
Therefore, the pair will likely break out lower since a bearish flag is usually a sign of bearish continuation. If this happens, the next reference level will be at this month’s low at 1.3352.

