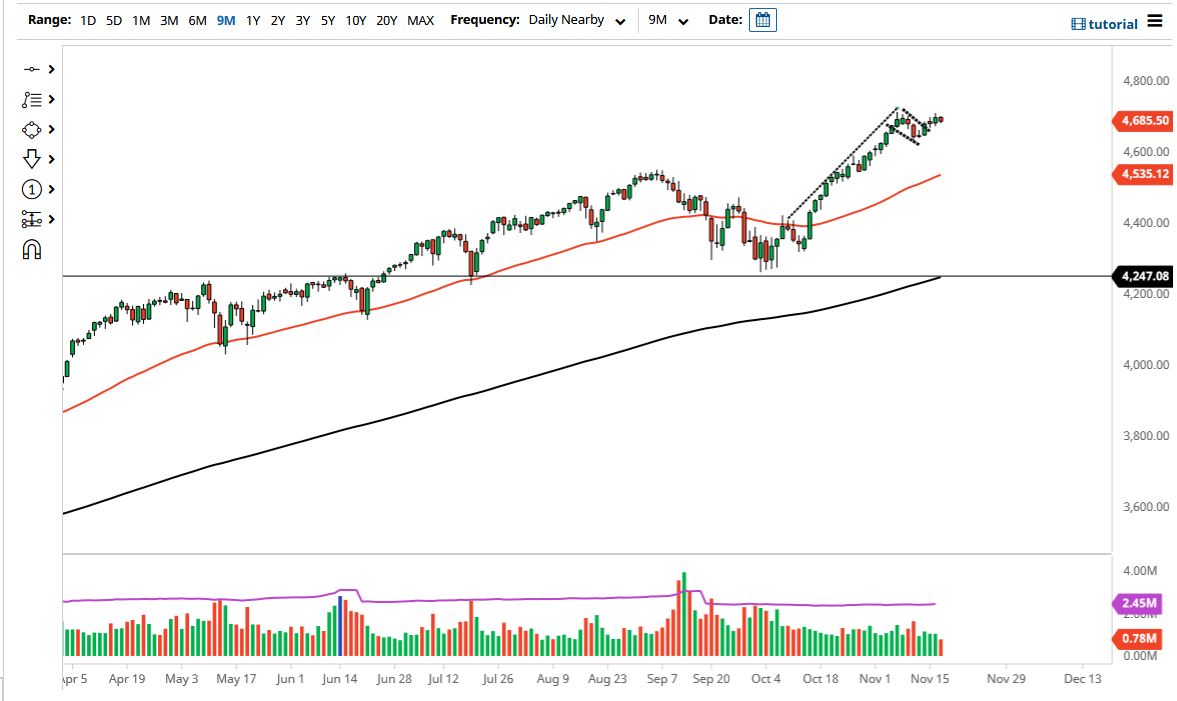
The S&P 500 went back and forth on Wednesday as we hang around the 4700 level. The 4700 level is an area that is a large, round, psychologically significant figure, but given enough time it is very likely that we will see is a continuation to the upside, especially as we have seen this market form a massive bullish flag. The massive bullish flag is a strong sign, so it makes sense that we would see a continuation of buying pressure. After all, we are getting through the earnings season with a relatively strong move, so at this point I think it is a market that will find plenty of reasons to rise.
Never forget the “Santa Claus rally”, which is at the end of the year when fund managers are trying to catch up from their losses or underperformance for the past 10 months or so. Anybody who is underneath their current benchmark is looking to make up those losses, and I think it is likely that we will continue to see every dip bought. The Federal Reserve is tapering but it is very loose with its monetary policy, and it should continue to be. The measured move from the bullish flag should suggest that the market could go as high as 5000, but that does not necessarily mean that it is going to happen overnight.
Underneath, the 4600 level is an area that I think should end up being a bit of support, but below there we even have the 50-day EMA reaching towards the upside, as the 50-day EMA is an important technical indicator that a lot of people pay attention to. I think you should continue to look at short-term pullbacks as opportunities, as the S&P 500 continues to rally on just a handful of stocks. As long as interest rates calm down, that should provide plenty of fuel for this market. Regardless, the Federal Reserve is beholden to Wall Street and makes sure it does not lose too much money over the longer term, which is something that it has proven to be true more than once over the last 13 years since the Great Financial Crisis. While it does sound cynical, all one has to do is go back and look at the actions of the Fed and time them with the charts.

