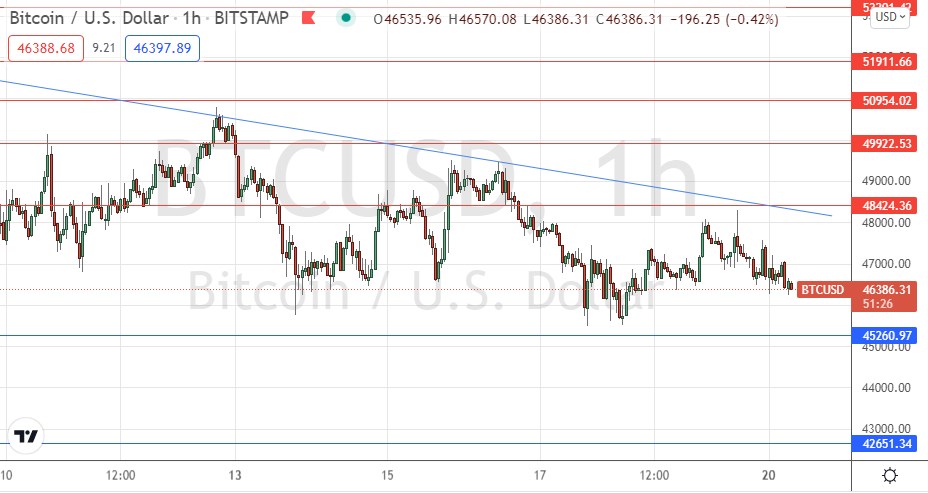
Last Monday’s BTC/USD signal could have produced a profitable long trade from the bullish bounce off the support level identified at $46,381, but the bullish price action would have been too slow for most traders to get an acceptable entry signal.
Today’s BTC/USD Signals
Risk 0.50% per trade.
Trades my only be taken prior to 5pm Tokyo time Tuesday.
Long Trade Ideas
Go long after a bullish price action reversal on the H1 time frame following the next touch of $45,261 or $42,651.
Place the stop loss $100 below the local swing low.
Adjust the stop loss to break even once the trade is $100 in profit by price.
Take off 50% of the position as profit when the trade is $100 in profit by price and leave the remainder of the position to run.
Short Trade Ideas
Go short after a bearish price action reversal on the H1 time frame following the next touch of $48,424, $49,923, $50,954, or $51,912.
Place the stop loss $100 above the local swing high.
Adjust the stop loss to break even once the trade is $100 in profit by price.
Take off 50% of the position as profit when the trade is $100 in profit by price and leave the remainder of the position to run.
The best method to identify a classic “price action reversal” is for an hourly candle to close, such as a pin bar, a doji, an outside or even just an engulfing candle with a higher close. You can exploit these levels or zones by watching the price action that occurs at the given levels.
BTC/USD Analysis
I wrote last Monday that the price was in a consolidation pattern with low volatility. So, it could be said that the price was very likely to remain between the nearest support at $46,381 and the nearest resistance at $49,923 over the course of the day. I thought that the support level at $46,381 was likely to be very strong.
This was a good and accurate call, which could have been used to successfully trade the bullish bounce made that day off the support level at $46,381.
The technical picture here has become more bearish, with the price chart below showing the situation has been dominated a descending bearish trend line suppressing the price for more than one week. The past week has also seen a clear (albeit slight) pattern of lower lows and lower highs. These factors suggest a continued decline in price is likely to happen over the coming days. However, it is worth noting that the strong support level I mentioned earlier at $46,381 has still not been touched since it was last reached a week ago, therefore we may well get a firm bullish bounce if and when it is reached.
My preference here would be a short trade from a bearish reversal at the nearest resistance level of $48,424 as it is confluent with the medium-term bearish trend line which is likely to have some technical impact.
There is nothing of high importance scheduled for today regarding the USD.

