Bearish View
Set a sell-stop at 45,500 and a take-profit at 43,000.
Add a stop-loss at 48,000.
Timeline: 1-2 days.
Bullish View
Set a buy-stop at 47,000 and a take-profit at 49,000.
Add a stop-loss at 45,000.
The BTC/USD pair is in a tight range as demand for Bitcoin and other cryptocurrencies wane. Bitcoin is trading at 46,300, which is in the same range as it has been in the past few days. The coin is about $20,000 below its highest level this year. Its total market capitalization has declined to about $853 billion.
Cryptocurrency Investments Rising
The BTC/USD is struggling even as interest in the blockchain industry has risen substantially. Recent data compiled by the New York Times showed that venture capital firms have invested more than $27 billion in cryptocurrency companies this year.
Some of the companies that have benefited from these investments are FTX, Gemini, Solana, BlockFi, and Dapper Labs. These investments provide signs that smart money managers believe that the blockchain industry will continue flourishing in the coming years.
The pair is also moving sideways because of the so-called tax-loss harvesting. This is a practice that is common in the United States. It involves selling loss-making assets in order to offset taxes of winning assets. It is a common practice by both institutional and retail investors.
The other key driver for the BTC/USD pair is the recent decision by the Federal Reserve. Last week, in its final decision of the year, the Fed decided to leave interest rates unchanged. The bank also hinted that higher interest rates will come in the coming year.
In theory, higher interest rates are usually negative for high-risk assets like Bitcoin and tech stocks. Indeed, the sell-off of Bitcoin has coincided with the overall weakness of the technology sector. In the past few days, the Nasdaq 100 index has declined by more than 600 points as worries of higher rates remain.
BTC/USD Forecast
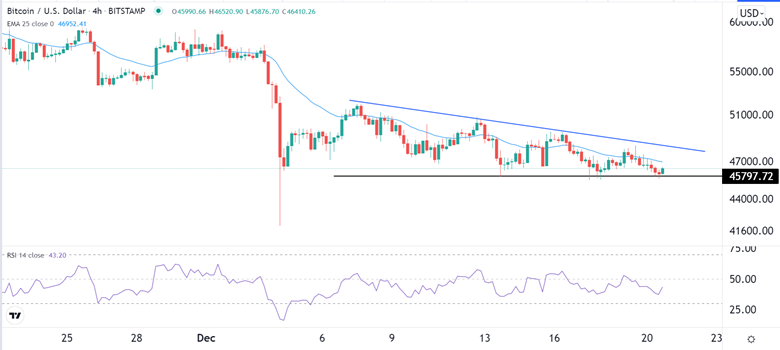
The four-hour chart shows that the BTC/USD pair found a strong support at 45,797 recently. A closer look at this pattern shows that it is similar to what happened in July when the pair declined slightly below $30,000.
The pair is slightly below the 25-day moving average while the Relative Strength Index (RSI) is at a neutral level. It is also slightly below the descending trend line that is shown in blue.
Therefore, the fact that the pair has struggled to move below 45,797 should comfort Bitcoin bulls. A bearish breakout will be confirmed if it moves below this support. Still, there is a likelihood that a rally to 50,000 will happen soon.

