Bullish View
Buy the BTC/USD pair and set a take-profit at 60,000.
Add a stop-loss at 56,000.
Timeline: 1-2 days.
Bearish View
Set a sell-stop at 57,000 and a take-profit at 55,000.
Add a stop-loss at 59,000.
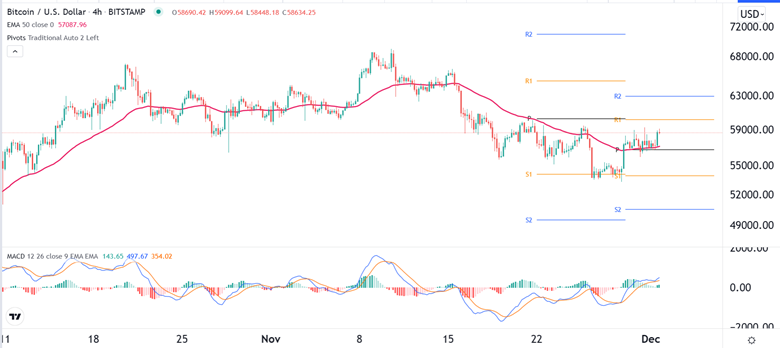
The BTC/USD tilted upwards as the market appeared to ignore the hawkish statement by the Federal Reserve chair. The pair also rose as investors reacted to the ongoing market action in the cryptocurrencies industry. It is trading at 58,600, which is about 9.75% above the lowest level in November.
No Taper Tantrum?
In his second day of testimony on Wednesday, Jerome Powell maintained his sentiment that the Fed will move to taper faster than expected. While stocks and Bitcoin declined slightly after this statement, they quickly bounced back since the hawkish central bank was already priced in.
The Dow Jones rose by more than 500 points on Wednesday while the Nasdaq 100 Index rose by more than 300 points. At times, there is usually a close correlation between major US indices and Bitcoin prices.
The BTC/USD also tilted higher after cryptocurrency companies continued making moves. On Wednesday, Crypto.com, the fast-growing exchange, announced that it will acquire two derivatives exchanges from IG Group. The two exchanges are Nadex and Small Exchange. The acquisition will be worth more than $250 million.
Crypto.com has been enjoying quick growth recently. In November, it announced that it will buy the naming rights of Staples Center in a $700 million deal. It also announced a major marketing plan worth more than $100 million.
Meanwhile, in an announcement, Fidelity announced that it will launch a spot Bitcoin ETF in Canada. This is major news since Fidelity is one of the biggest companies in the United States. The difference between this fund and BITO is that the latter tracks Bitcoin futures.
The next key catalyst for the BTC/USD will be the US initial jobless claims numbers scheduled for later today and the official NFP scheduled for Friday.
BTC/USD Forecast
The four-hour chart shows that the BTCUSD pair has been in a tight range in the past few days. The pair is trading at about 58,600, where it has been in the past few days. It is also slightly above the 25-day moving average.
A closer look shows that the pair has formed a bullish flag pattern. In price action analysis, this pattern is usually bullish. The pair has also formed an inverted head and shoulders pattern. Therefore, there is a likelihood that the pair will bounce back higher in the near term. If this happens, the next level to watch will be at 60,000.

