Bullish View
Set a buy-stop at 1.1320 and a take-profit at 1.1385.
Add a stop-loss at 1.1200.
Timeline: 1-2 days.
Bearish View
Set a sell-stop at 1.1265 and a take-profit at 1.1200.
Add a stop-loss at 1.1350.
The EUR/USD pair wavered on Tuesday morning as worries of the Omicron variant waned and as the market waited for the latest Eurozone GDP data. It is trading at 1.1280, which is slightly below its highest level on Monday.
EU GDP Data
Fears of the impact of the Omicron variant have subsided as evidenced by the performance of US stocks. The Dow Jones index rose by more than 600 points while the S&P 500 rose by more than 40 points. This happened after reports emerged that the variant is causing milder illness than previously feared.
The EUR/USD also moved sideways as the market continued to reflect on the hawkish tone by the Federal Reserve. In a statement last week, the Federal Reserve chair said that the bank will increase the size of tapering. Additionally, the pair is moving sideways after the mixed US jobs numbers that were published on Friday.
The next key catalyst for the EUR/USD will be the latest Eurozone GDP numbers. Economists expect the data by Eurostat to show that the Eurozone economy expanded by 2.2% in the third quarter. On a year-on-year basis, the GDP expanded by 3.7%.
While these numbers will be important, their impact on the pair will be relatively muted because they are the second reading. Other key data that will be published by Eurostat are the latest Eurozone employment change and economic sentiment.
Meanwhile, in Germany, the ZEW Institute will publish the latest economic sentiment data. Economists expect that business sentiment declined slightly in December as the number of Covid cases rose. The German government has imposed tougher restrictions on the unvaccinated.
The EUR/USD will also react mildly to the latest US exports, imports, and trade deficit numbers from the US. Still, the bigger picture that is moving the pair is the divergence between the Fed and the ECB.
EUR/USD Forecast
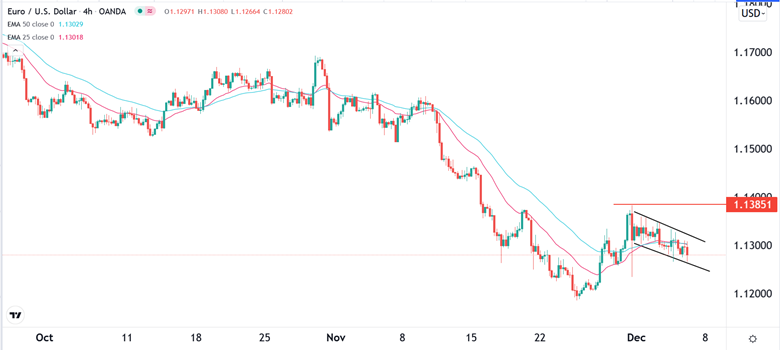
The four-hour chart shows that the EUR/USD has declined slightly in the past few days. It has declined by about 1% from its highest level on November 30. The pair has also declined slightly from the 25-day moving average.
A closer look shows that it has formed a descending channel pattern that is shown in black. It has also formed a small inverted head and shoulders pattern. This pattern is usually a bullish signal.
Therefore, the pair will likely break out higher in the coming days. If this happens, the next resistance will be at 1.1385.

