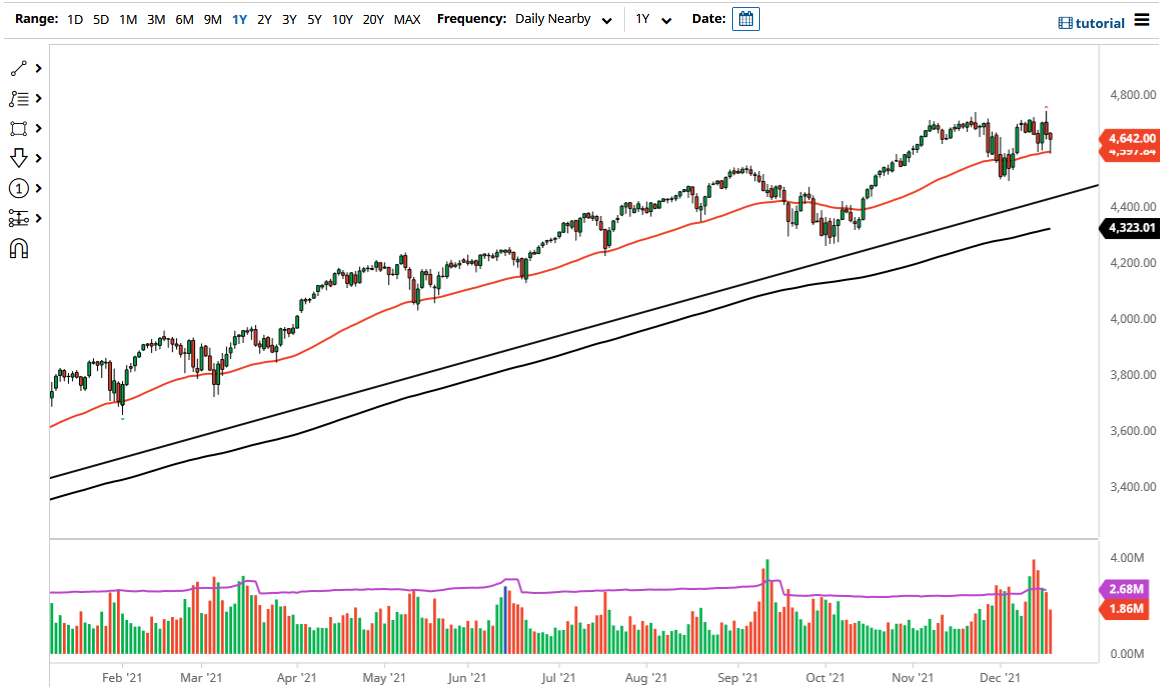
The S&P 500 fell a bit on Friday but found enough support at the 50-day EMA in order to cause a little bit of a bounce. At this point, the market is likely to continue to see a lot of noisy behavior, and perhaps consolidation due to the fact that we are heading towards the end of the year, a time when there is very little in the way of liquidity. That lack of liquidity should continue to be a major driver, but at this point in time you get a lot of traders trying to catch up to their benchmarks, meaning that we need to make money for clients.
At this point in time, the 50-day EMA is a technical indicator that a lot of people would pay close attention to, and a bounce from here would make a certain amount of sense. Then it is likely that we could go looking towards the all-time highs again, perhaps towards the 4800 level after that. To the downside, if you break down below the bottom of the candlestick for the trading session on Friday, it is very likely that we could go looking towards the 4500 level which is a large, round, psychologically significant figure.
Breaking down below the 4500 level would be a very negative turn of events and could open up the possibility of testing the uptrend line underneath. If we break down below there, then the market is likely to continue going lower and at that point I am more than willing to start buying puts. On the other hand, if we turn around and break above the highs of the Thursday session, then it is likely that we would go looking towards the 4800 level. Longer term, I think we could go looking towards the 5000 level, but traders are very concerned about whether or not the Federal Reserve is going to over-tighten, but I think the Federal Reserve will come to the aid of Wall Street if it starts to throw a tantrum, so that is something to keep in the back of your mind. In general, this is a market that is still very much in an uptrend, and even though we had a couple of rough days, at the end of the day we are just 150 points from the absolute all-time high.

