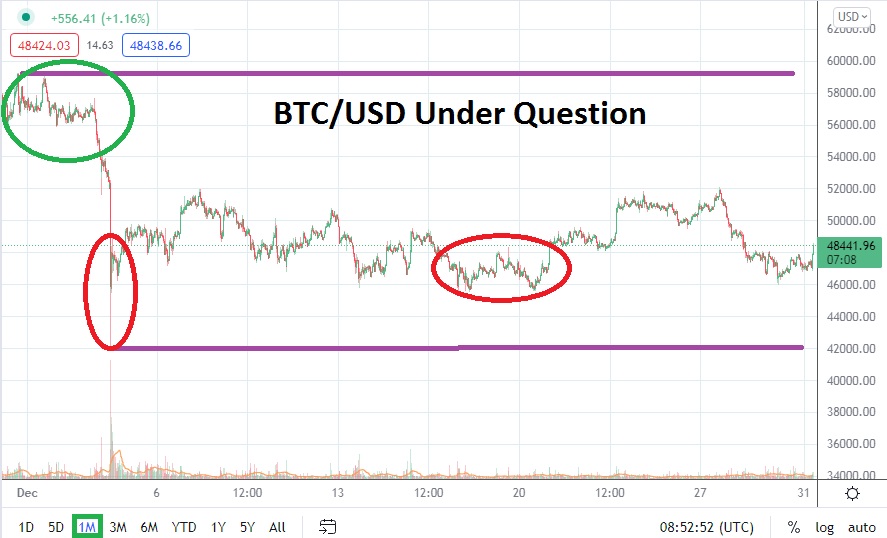
The high for Bitcoin in December came on the 1st of the month when BTC/USD was trading near the 59,000.00 mark. This high was demonstrated in late November too, after BTC/USD hit a low of nearly 53,500.00 on the 28th of November and reversed upwards. Since touching these short term highs at the beginning of the month, BTC/USD has quite simply struggled. As January gets ready to display a brand new year, the world’s most famous cryptocurrency is fighting near important support levels and looks suspiciously uneasy.
The price of BTC/USD as of this writing is near the 48,400.00 mark with a typical amount of fast trading being shown. On the 27th of December BTC/USD did stage a polite reversal higher and climbed to approximately the 52,200.00 ratio, and this was accomplished after Bitcoin hit a low of nearly 45,650.00 on the 20th of December and gradually rose higher until the price seen only a few days ago.
But the high of 52,200.00 seen on the 27th was not able to be sustained and in fact BTC/USD has again slumped under towards support levels which are likely making bullish speculators nervous. There is a significant difference in Bitcoin investors and speculators. Proponents who are investors of BTC/USD who buy and hold may not feel the negative effects of downturns, compared to short-term traders who seek quick profits and are using leverage to try and capture positive results.
Technically, BTC/USD when looking at a long-term chart of six months doesn’t look positive in many respects. Perhaps an optimistic bullish short-term trader may look at current price value and believe Bitcoin has been oversold and will bounce back, but the question about when this will occur is an important factor for short term wagers. Only two days ago, BTC/USD tested and broke below 47,000.00.
If current support levels continue to be pestered by selling nervousness, the ability of BTC/USD to continue a downward trajectory is certainly a possibility. The broad cryptocurrency mark relies heavily upon the sentiment which is generated by Bitcoin. If the major cryptocurrency cannot climb to the 50,000.00 mark and sustain its value above this key psychological juncture, this may continue to cause bearish sentiment to generate not only for BTC/USD but other digital assets too.
BTC/USD Outlook for January
Speculative price range for BTC/USD is 40,700.00 to 59,000.00.
In many respects BTC/USD delivered an actual consolidated range after seeing a flash crash develop on the 3rd of December which saw value briefly of nearly 42,300.00. The trading range of BTC/USD has largely been between 46,000.00 and 51,600.00 with a few outliers the past few weeks.
If current support near the 48,000.00 begins to be challenged and proven vulnerable, sellers could legitimately aim for the 47,500.00 range as a take profit. However, before traders become overly ambitious they need to calculate the size of a one thousand dollar move while also making sure the amount of leverage they use is cautious. Most short-term traders are likely inclined to look for even smaller moves within BTC/USD. If current support levels falter, BTC/USD could see a test of lower values which could bring late September prices into view.
Optimistic buyers who believe BTC/USD is oversold will certainly be heard from. But the question is if they will be able to point to positive results upward in January that will prove skeptics wrong? If BTC/USD is able to muster an attack on the 50,000.00 level and sustain prices over this juncture, bullish traders may be proven correct. Bitcoin remains extremely volatile. Traders who are lucky enough to capture the price action they speculate on should consider cashing out profits, before they vanish into thin air because of a sudden reversal. If BTC/USD is able to break through the 52,000.00 threshold and maintain this level, it could signal another round of bullish speculation is about to renew.

